
1 February 2024: Wealth Product Ideas

The Rise of India’s Digital Decade
- India’s digital transformation is underway, with significant growth potential.
- Digital services have become integral for over 700 million Indians.
- The digital economy is projected to reach a $1 trillion valuation by 2023.
- Large corporations like Reliance Industries and Tata Group are building digital ecosystems.
- ETF investment opportunities in India’s digital economy include VanEck Digital India ETF (DGIN) and India Internet & Ecommerce ETF (INQQ).
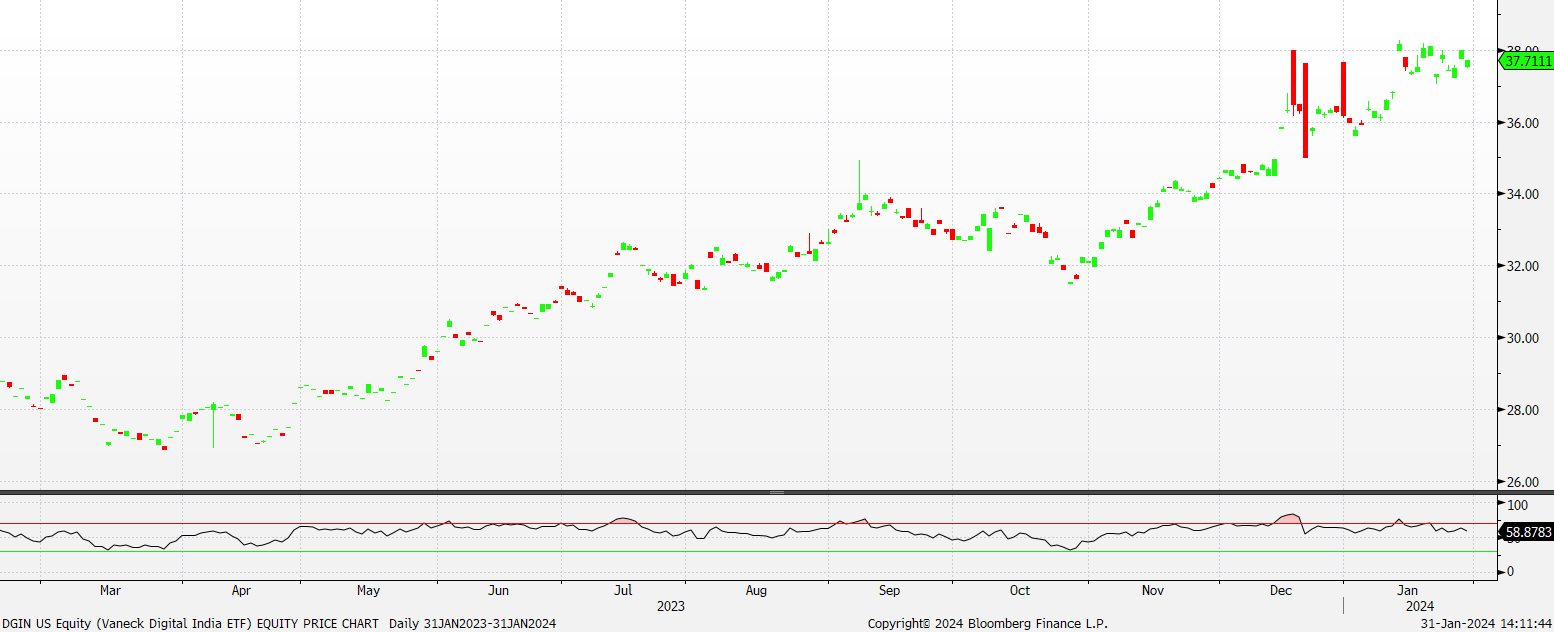
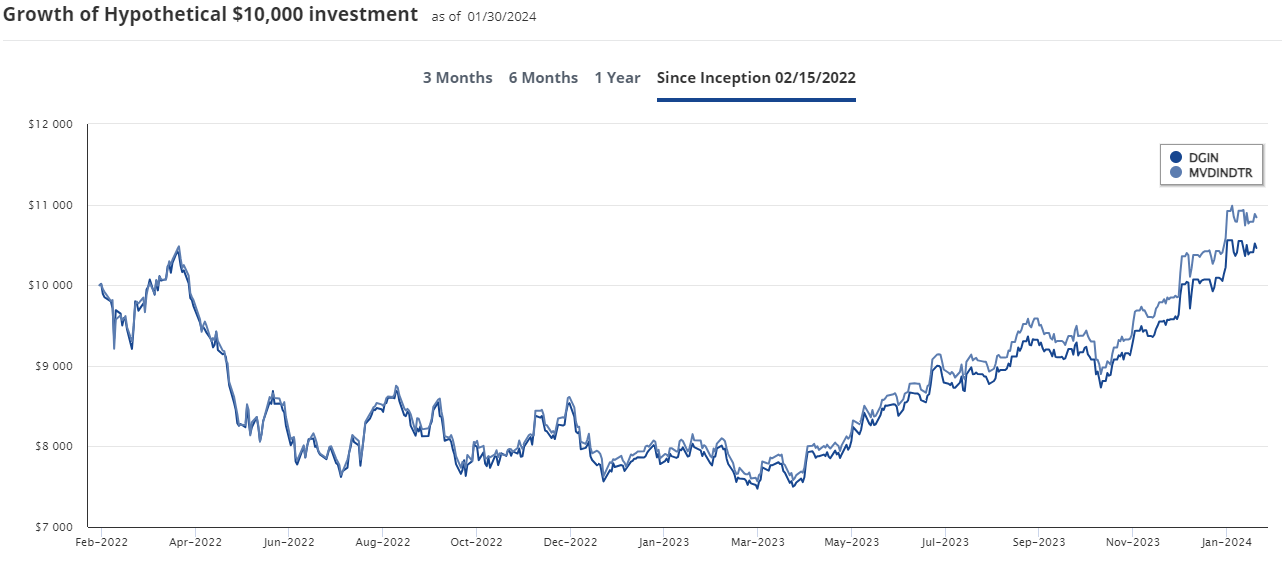
Fund Name (Ticker) | VanEck Digital India ETF (DGIN) |
Description | VanEck Digital India ETF (DGIN) seeks to track as closely as possible, before fees and expenses, the price and yield performance of the MVIS® Digital India Index (MVDINDTR), which is intended to track the overall performance of companies involved in supporting the digitization of the Indian economy. |
Asset Class | Equity |
30-Day Average Volume (as of 30 Jan 2024) | 11,904 |
Net Assets of Fund (as of 30 Jan 2024) | US$11,240,000 |
12-Month Yield (as of 30 Jan 2024) | 0.24% |
P/E Ratio (as of 31 Dec 2023) | 31.86 |
P/B Ratio (as of 31 Dec 2023) | 5.40 |
Management Fees (Annual) | 0.71% |
Top 10 Holdings
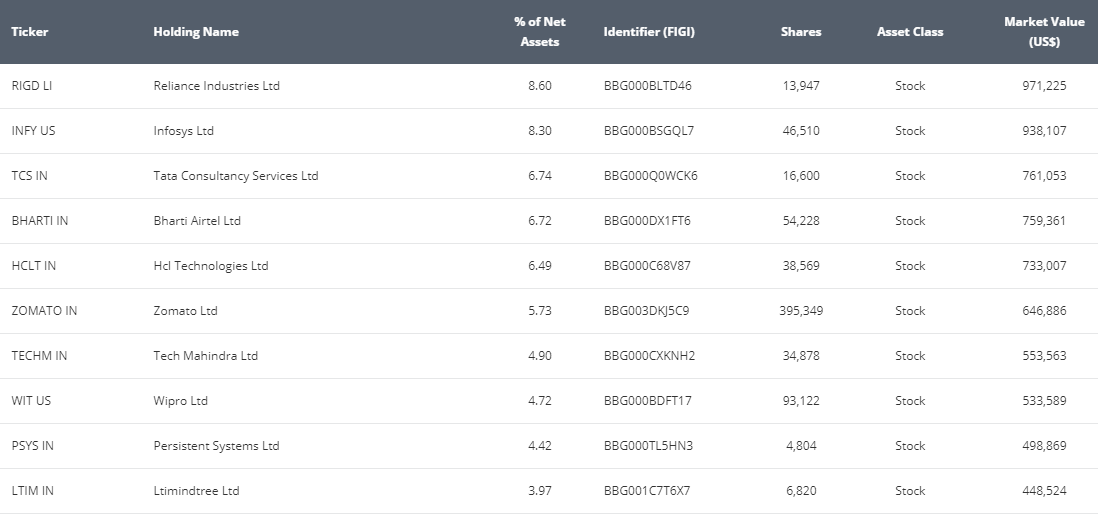
(as of 29 January 2024)

(Source: Bloomberg)

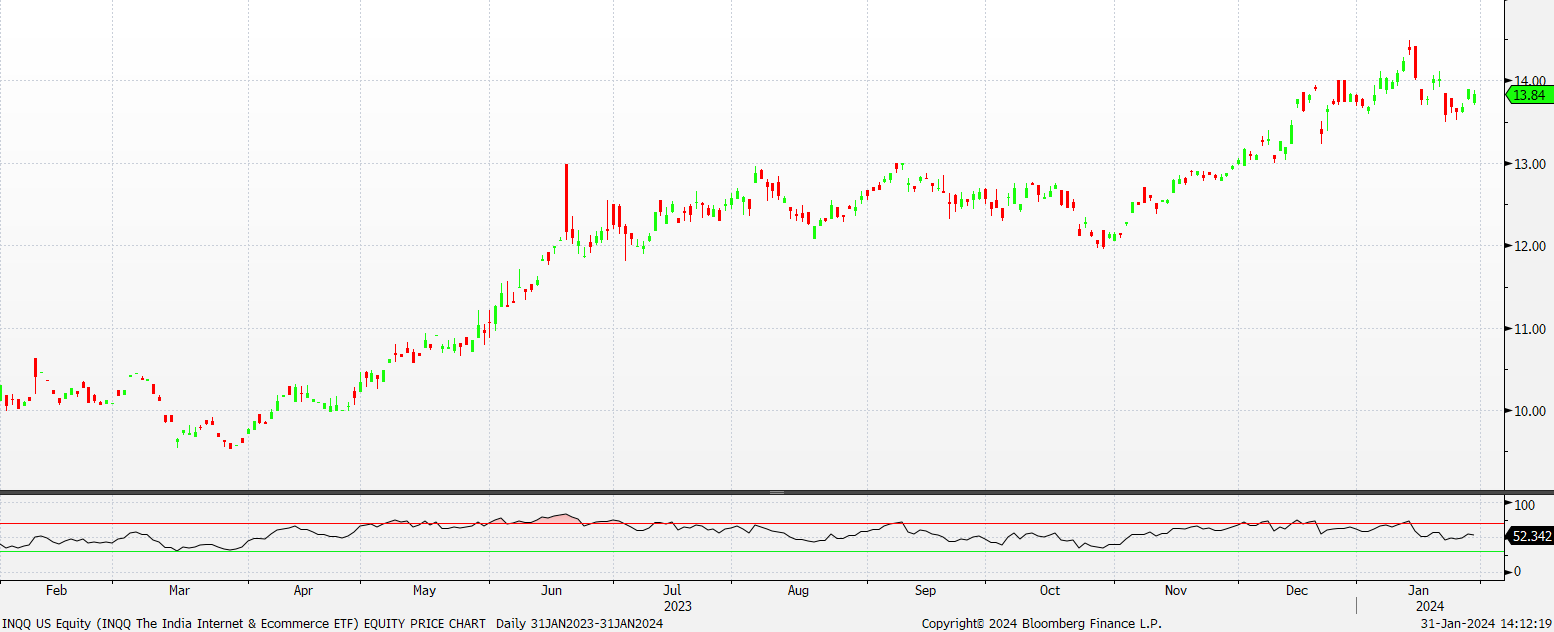
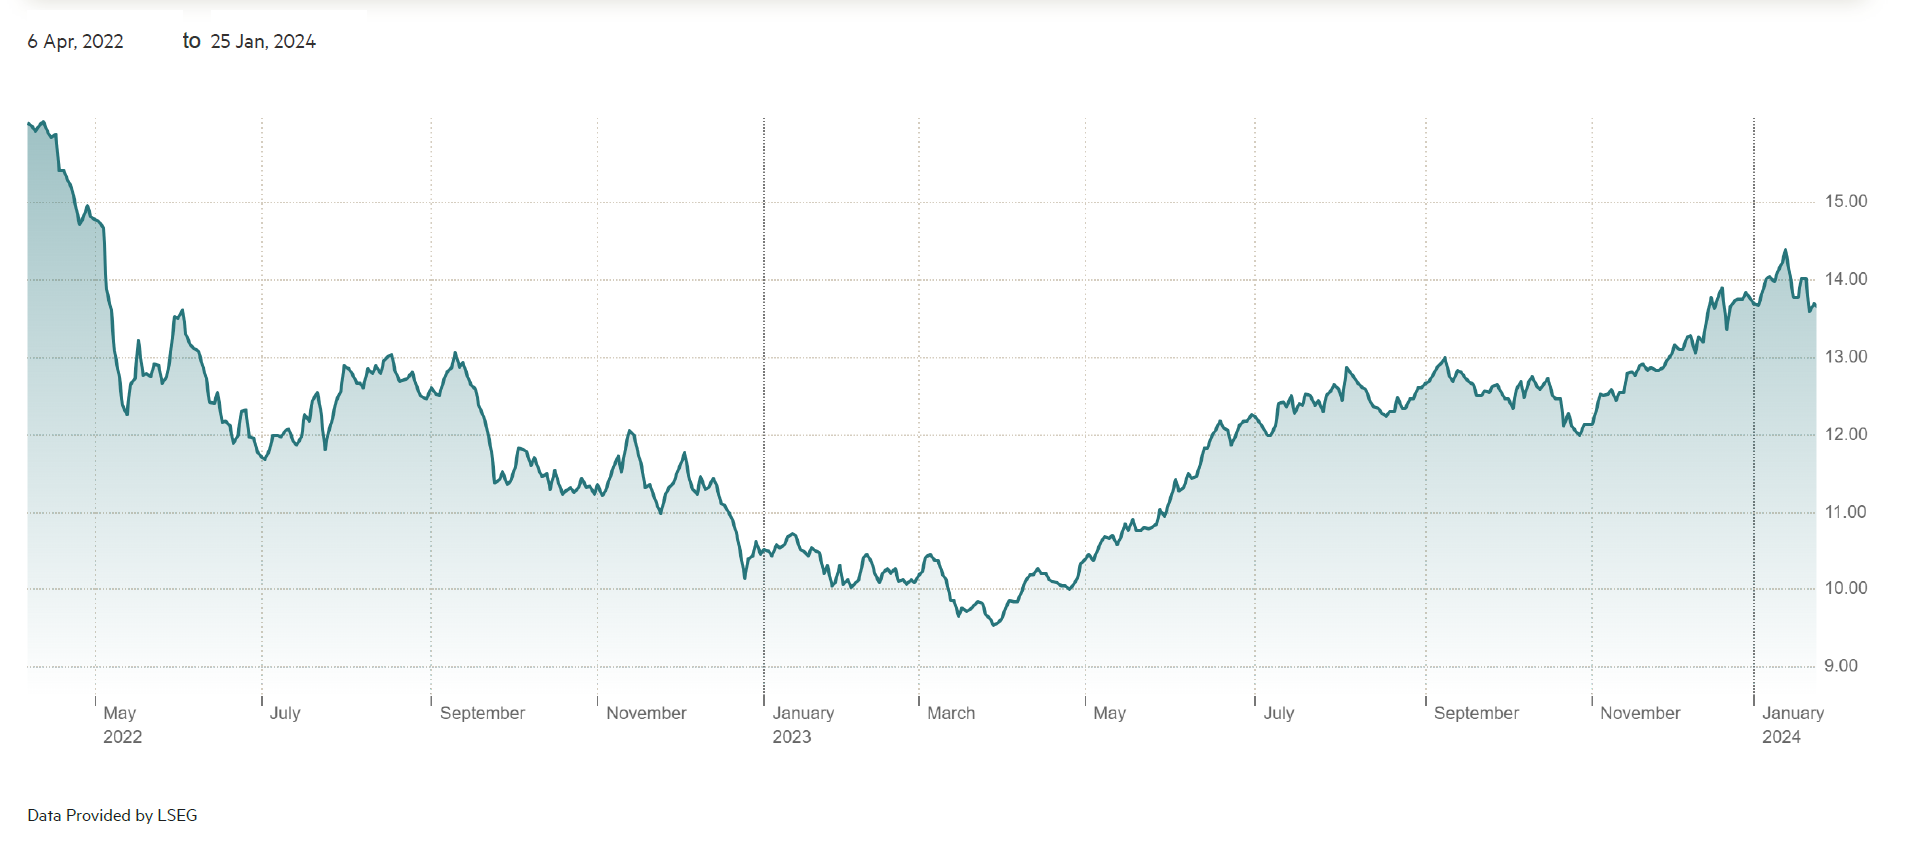
Fund Name (Ticker) | India Internet & Ecommerce ETF (INQQ) |
Description | INQQ The India Internet & Ecommerce ETF (NYSE: INQQ) is an Exchange-Traded Fund (“ETF”) that tracks an index of the leading Internet and Ecommerce companies of India. It offers investors targeted exposure to the growth of online consumption and digitizing lifestyles in India. |
Asset Class | Equity |
30-Day Average Volume (as of 30 Jan 2024) | 38,397 |
Net Assets of Fund (as of 29 Jan) | US$21,473,431 |
12-Month Trailing Yield | NA |
P/E Ratio (as of 30 Jan 2024) | 33.738 |
P/B Ratio (as of 30 Jan 2024) | 0.006 |
Management Fees (Annual) | 0.86% |
Top 10 Holdings
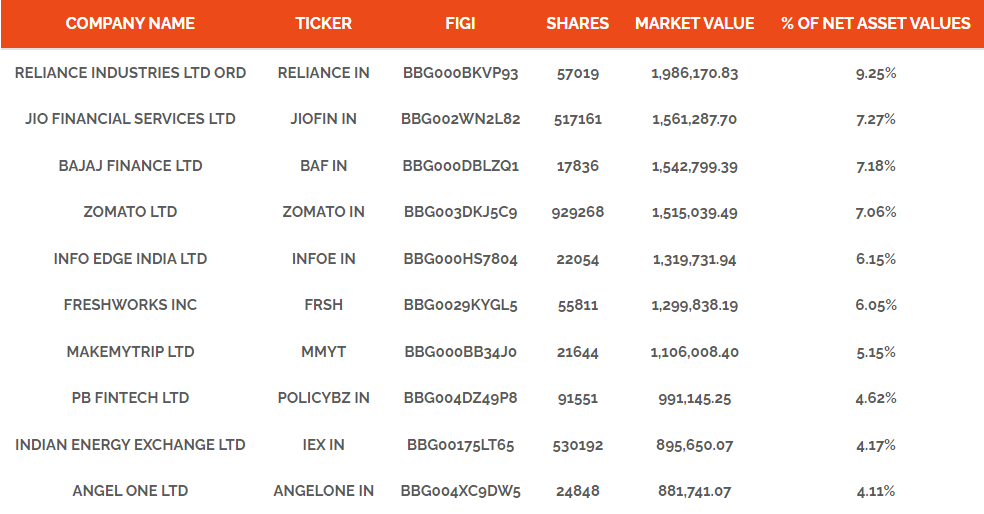
(as of 29 January 2024)

(Source: Bloomberg)
(Source: Bloomberg)