Gold & Silver/Forex Analysis – 24 July
Gold & Silver – Bull trend intact

- News update
- Macro analysis
- US rate hike cycle coming to an end. The June inflation in the US continued to decline to 3% YoY, the lowest since March 2021, beating the consensus of 3.1%. The June core inflation fell to 4.8%, the lowest since October 2021. As Fed’s view on rate hikes is data-dependent, the downward trajectory of inflation favours a dovish stance toward further rate hikes. The current market consensus of the Fed fund rate peaks at 5.50% and the rate cut cycle is expected to start in 1Q24.
- US recession concerns mitigated. Recent macro data implied that the US could avoid a recession in the near term. Private businesses surprisingly created 497 thousand jobs in June, the most since February 2022, beating estimates of 228 thousand. Though June’s nonfarm payroll arrived at 209 thousand, missing the consensus of 225 thousand, the unemployment rate stood at 3.6%. Preliminary consumer confidence in July surged to 72.6, the highest since September 2021, well above the consensus of 65.5. The housing market started rebounding as building permits, housing starts, and new/existing home sales were better than expected. The overall US economy is resilient amidst the high inflation and interest rate environment.
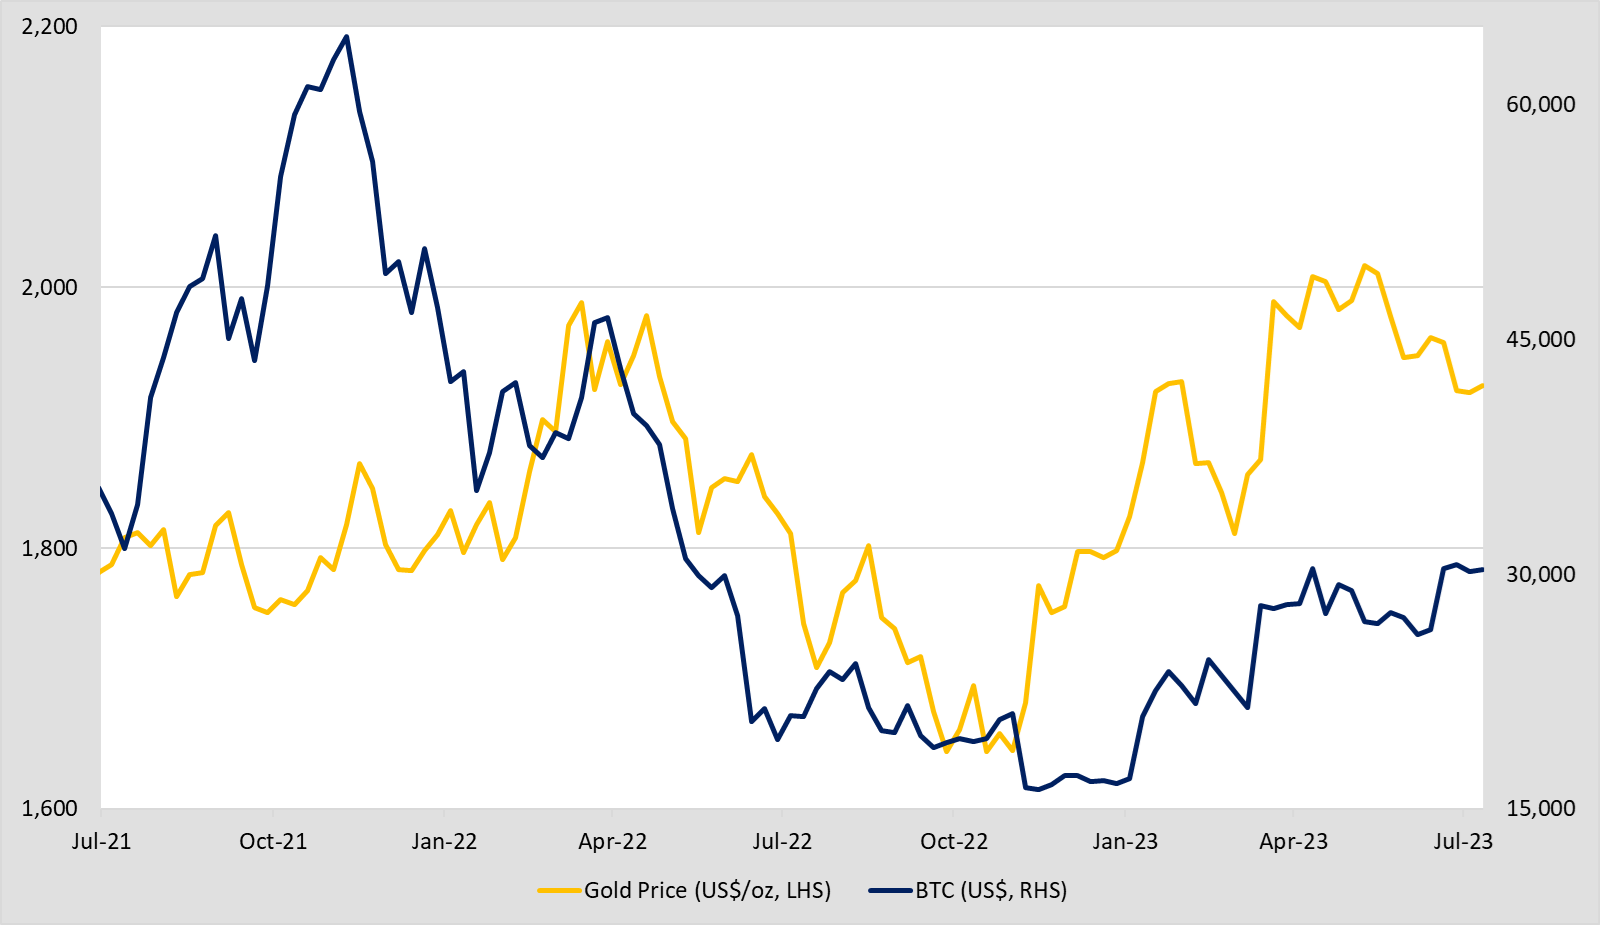
- Crypto boom reviving. BlackRock and Fidelity have submitted applications to launch spot bitcoin ETFs. The embrace of Bitcoin by the two asset management giants could clear doubts on the gloomy crypto outlook after the FTX’s failure. Moving forward, it is expected more fund inflows into crypto markets. Gold and Bitcoin showed positive correlations since the rate hike cycle started.
- Gold technical analysis
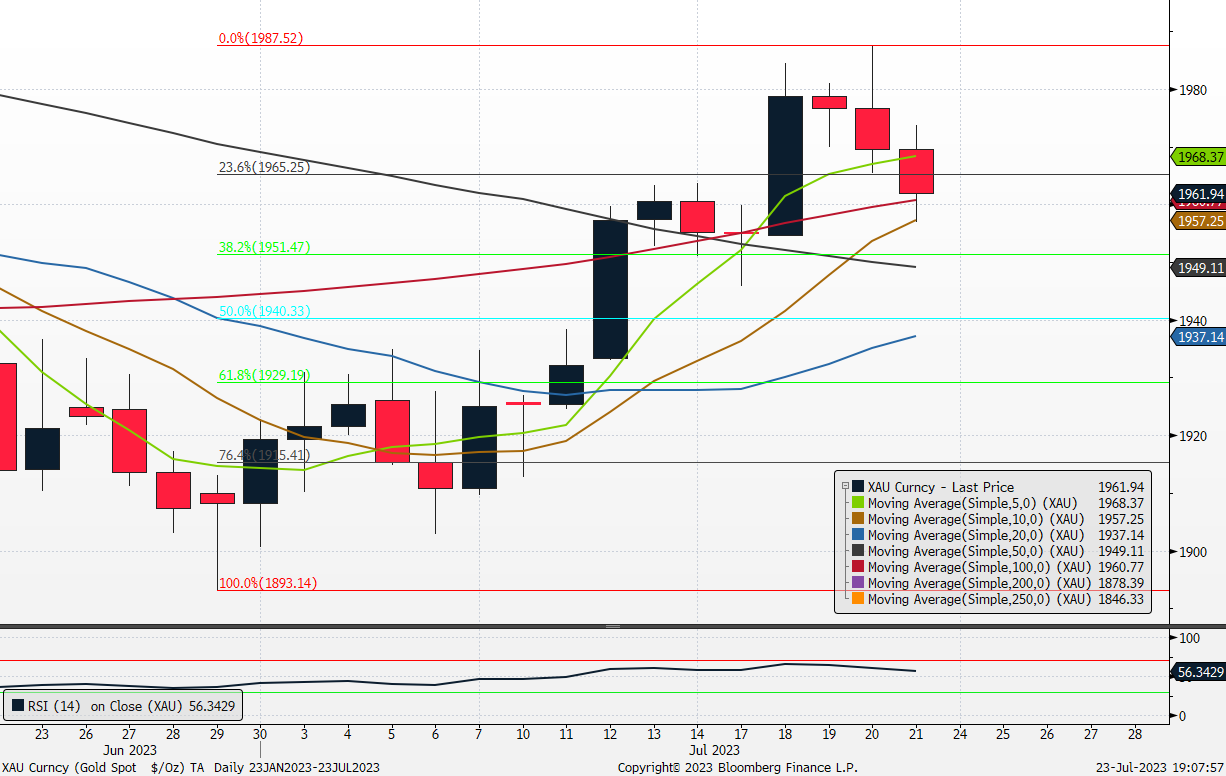
(Source: Bloomberg)
- Fibonacci retracement: 1893.14/1915.41/1929.19/1940.33/1951.47/1965.25/1987.52
- Simple moving average:1957.25/1960.77/1968.37/1949.11
- Silver technical analysis
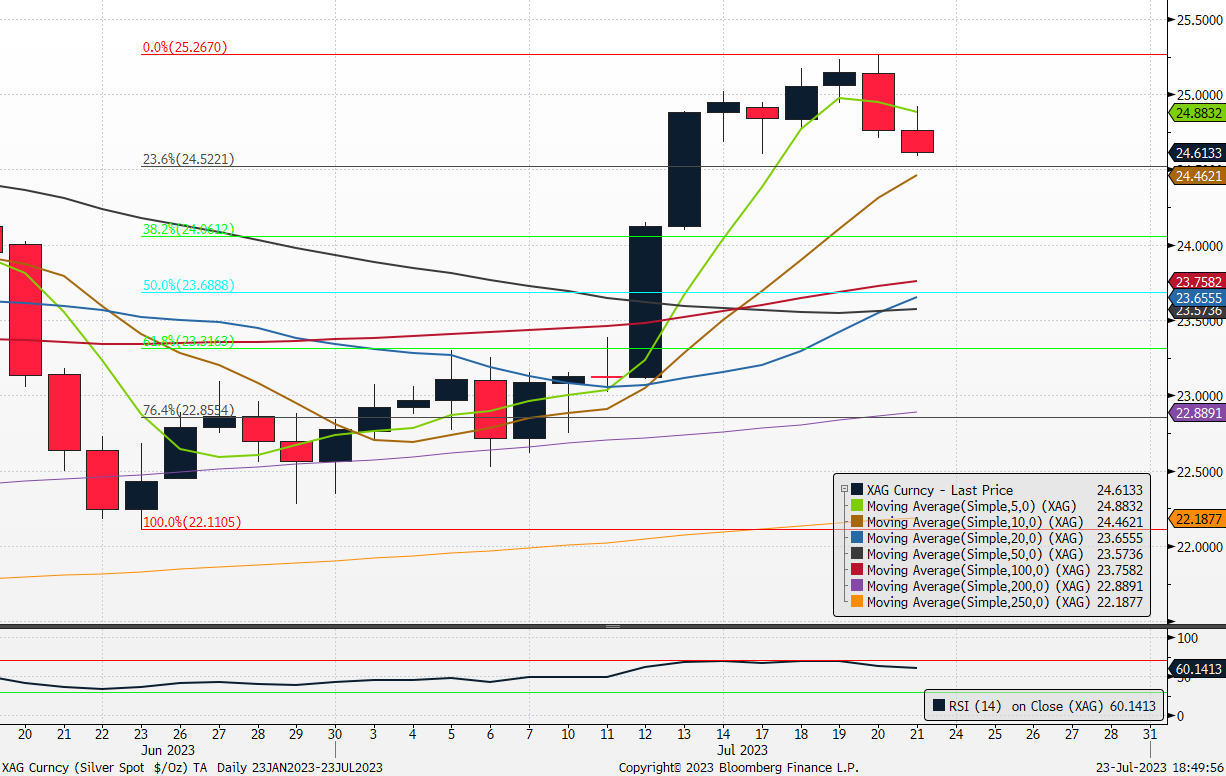
(Source: Bloomberg)
- Fibonacci retracement: 25.2670/24.5221/24.0612/23.6888/22.3163/22.8554/22.1105
- Simple moving average: 24.4621/24.8832
- Gold and US Dollar Index
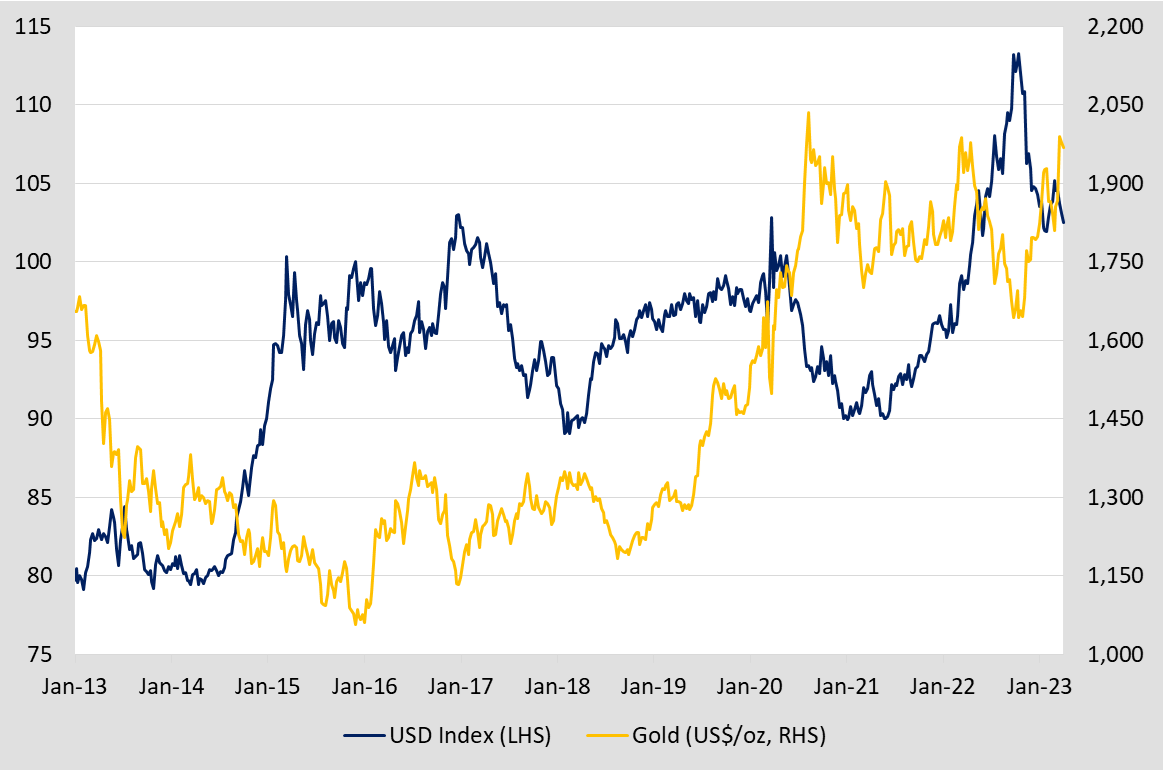
(Source: Bloomberg)
- Gold and BTC Price Trend
(Source: Bloomberg)
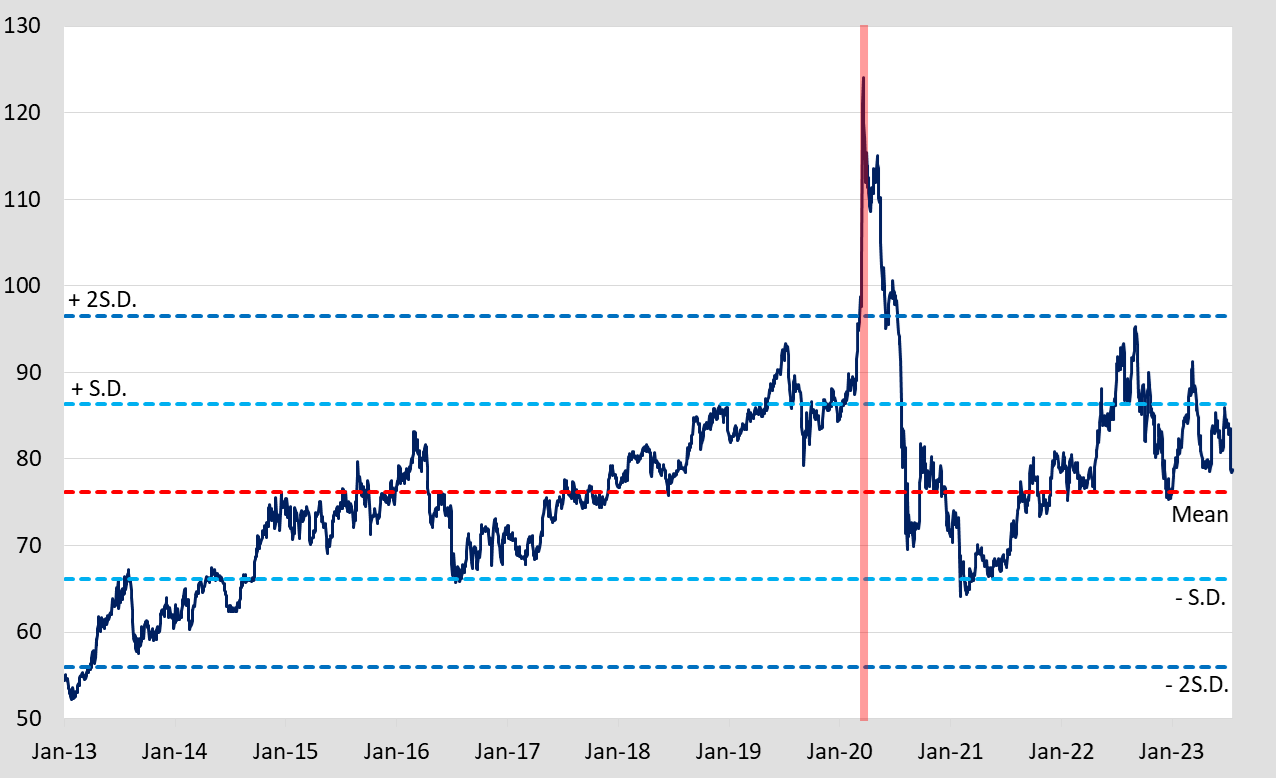
- Gold/Silver Ratio
(Source: Bloomberg)

Forex
- Weekly Recap
- US retail sales figures rose 0.2% MoM in June to $689.5bn, below the market expectation for an increase of 0.5%. This positive indication of consumer spending is usually seen as bullish for the USD.
- US single-family homebuilding fell by 7.0% to a rate of 935,000 units in June, following a surge in May that reached 1.005mn units, the highest in 11 months. However, permits for future construction rose to a 12-month high, indicating ongoing momentum in the housing market. Builders continue to face challenges due to material shortages and higher borrowing costs. The housing supply remains low, and multi-family housing starts declined by 11.6% to 482,000 units, the lowest since December.
- The number of Americans filing new claims for unemployment benefits unexpectedly fell last week to a seasonally adjusted annual rate of 228,000, the lowest level in two months. This decline in jobless claims, along with recent data showing easing inflation, raised cautious optimism about the economy avoiding a recession this year.
- The market is expecting the Fed to hike interest rates for the final time by 25bp in the next FOMC meeting beginning on Tuesday. Investors will be focused on future guidance for the remainder of the year, and whether the FOMC is still convinced it will hike the Fed Funds target rate all the way to 5.50%-5.75%, as previously outlined.
- The dollar index rose and settled at 100.82, after data showed that US Initial Jobless Claims fell to 228,000, its lowest since mid-May. Investors have priced another rate hike of 25bps in July. The labour market remains tight, supporting wage growth and consumer spending. Despite manufacturing and housing struggles, the low number of layoffs and a resilient labour market indicate ongoing momentum in the economy. Investors are closely monitoring the possibility of further rate hikes following the anticipated July hike.
EUR/USD – Short-term bearish reversal
- Key data review
- The European Central Bank also released its inflation rate and core inflation rate last Wednesday. The inflation rate was reported to be at 5.5% YoY in June from a figure of 6.1% in May and is in line with the consensus and forecasted rate. The core inflation rate is also reported to be at 5.5% in June, compared to a figure of 5.3% in May, and higher than the consensus and forecasted rate of 5.4%. This higher-than-expected core inflation rate for June displayed the stickiness of inflation in the Eurozone and raises expectations for more rate hikes in the near term. As a result, the EUR/USD rose 19.7 pips over the next 60 mins but fell back and closed at 1.1176 when Europe market closed.
- Fundamentals
- European Central Bank officials generally agreed that the central bank would consider raising interest rates beyond July due to concerns about prolonged high inflation, which raised doubts about achieving the inflation target within a reasonable timeframe.
- US inflation rate appears to be showing signs of improving, compared to a more sticky inflation in the Eurozone. Eurozone is likely to release a more hawkish statement on its interest rate hikes, and as a result, EUR/USD currency pair is likely to have an upwards momentum.
- Technical analysis
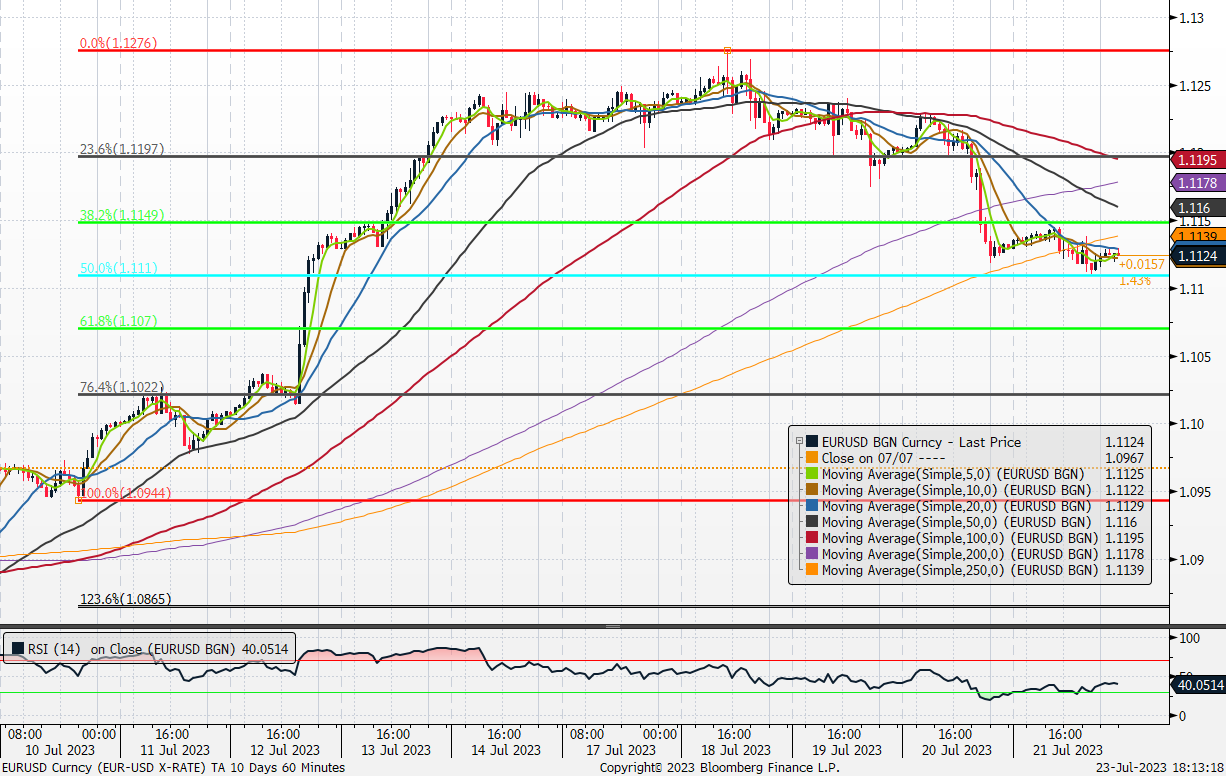
- Fibonacci retracement: 1.1276/1.1197/1.1149/1.1110/1.1070/1.1022/1.0944
- Simple moving average:1.1139/1.1160/1.1178/1.1195
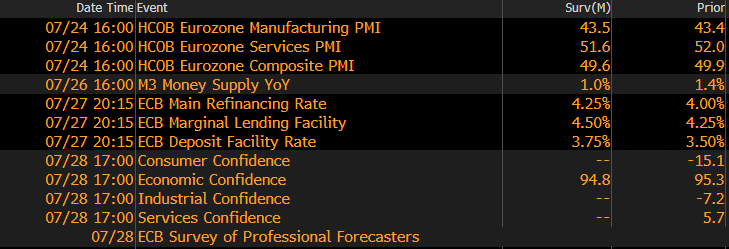
- Key economic calendar
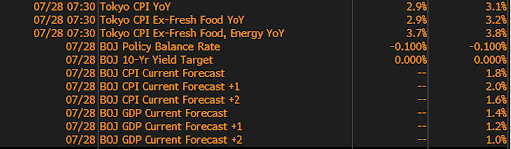
USD/JPY – Pivot back to the bearish trend
- Key data review
- On Thursday, the June balance of trade data shifted to a surplus of JPY 43.05bn increasing from the previous deficit of JPY 1,372.5bn in May and beating the consensus of JPY 46.7bn deficit, marking the first surplus in 22 months. This came as exports increased 1.5% YoY and imports decreased by 12.9% YoY. USD/JPY fell more than 500 pips after the trade data was released in the morning session but fully rebounded in the afternoon session.
- June inflation data released on Friday rose to 3.3% from the previous 3.2% in May, lower than the 3.5% previously forecast. USD/JPY fell 200 pips immediately but surged 530 pips by 10:30 am.
- Several media sources said BOJ would probably keep its yield control policy unchanged at next week’s meeting at 15:25 on Friday. USD/JPY surged more than 1,600 pips and broke above the 20dSMA.
- Fundamentals
- In its mid-year review of its forecasts, the Japanese government recently lowered its economic growth forecasts and expects a 1.3% economic expansion for the current fiscal year, lower than the previous 1.5% projection in January. It expects the economy to grow 1.2% in fiscal 2024.
- The JPY gained support from an increase in Japan’s core inflation rate, with the National core CPI rising to a 3.3% year-on-year rate in June, and the headline CPI remaining above the Bank of Japan’s 2% target for the 15th consecutive month. With the inflation rate failing to meet the Bank of Japan’s expectations for the fifteenth consecutive month, the market is expecting them to no longer commit to its ultra-easy monetary policy. Investors are eagerly anticipating the policy meeting decision at the upcoming BOJ meeting scheduled for Thursday and Friday.
- Technical analysis
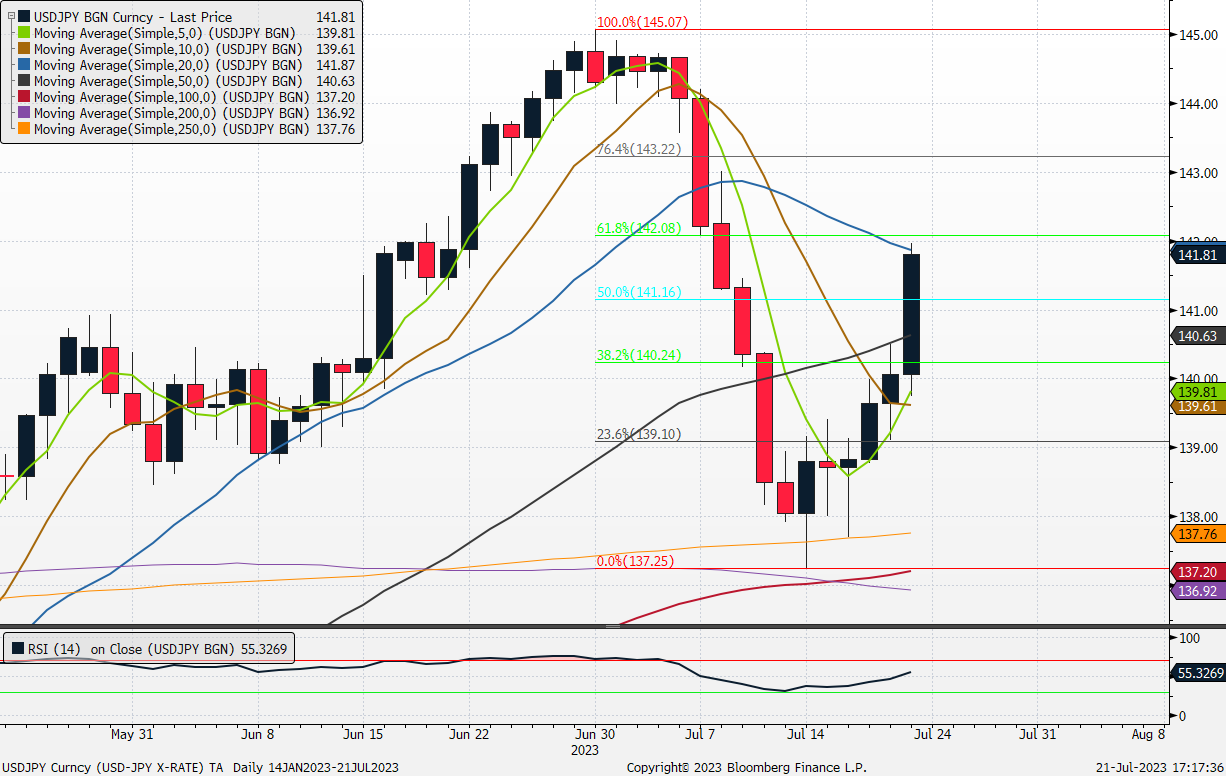
- Fibonacci retracement: 145.07/143.22/142.08/141.16/140.24/139.1/137.25
- Simple moving average:141.87/140.63/139.80
- Key economic calendar