30 March 2023: Wealth Product Ideas

| Fund Name (Ticker) | VanEck Gold Miners ETF (GDX US) |
| Description | VanEck Gold Miners ETF (GDX) seeks to replicate as closely as possible, before fees and expenses, the price and yield performance of the NYSE Arca Gold Miners Index (GDMNTR), which is intended to track the overall performance of companies involved in the gold mining industry. |
| Asset Class | Equity |
| 30-Day Average Volume (as of 28 Mar) | 26,635,354 |
| Net Assets of Fund (as of 28 Mar) | US$13,726,012,700 |
| 12-Month Trailing Yield | N/A |
| P/E Ratio (as of 28 Mar) | 49.049 |
| P/B Ratio (as of 28 Mar) | 1.679 |
| Management Fees (Annual) | 0.50% |
Top 10 Holdings
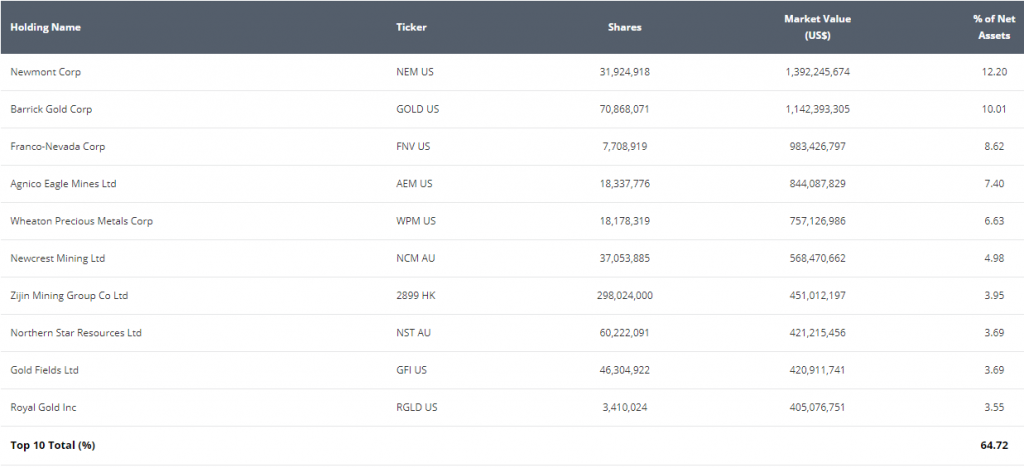
(as of 28 Feb 2023)

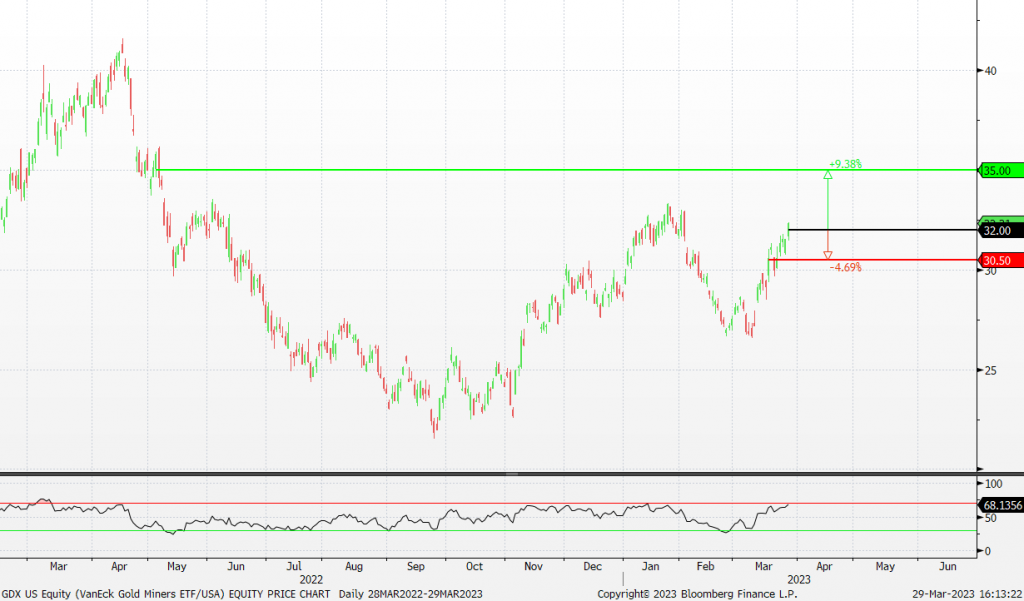
- BUY Entry –32.0 Target – 35.0 Stop Loss – 30.5
- Better outlook for gold price in 2023. There are several factors that impact gold prices, and the key ones are the trend of the US dollar and global geopolitical risk. The broad market has expected that US dollars peaked last year as inflation has been on a downswing. Even though recent macro data such as CPI and core PCE prices showed overall prices were declining. The US job market started showing some weaknesses as the unemployment rate rose to 3.6% in February. The market expects Fed to cut rates in 2H23. On the other hand, geopolitical tensions remain high and probably escalate anytime as China-US confrontations are more frequent. Gold is the good old safe haven.
- Market uncertainty. With the recent banking crisis and high interest rate environment, there is a lot of speculation as to whether interest rates and inflation will continue to rise leading prices to become more volatile. Investors may decide to invest in Gold in the event another unforeseen crisis arises.
Gold Price and Dollar Index Trend
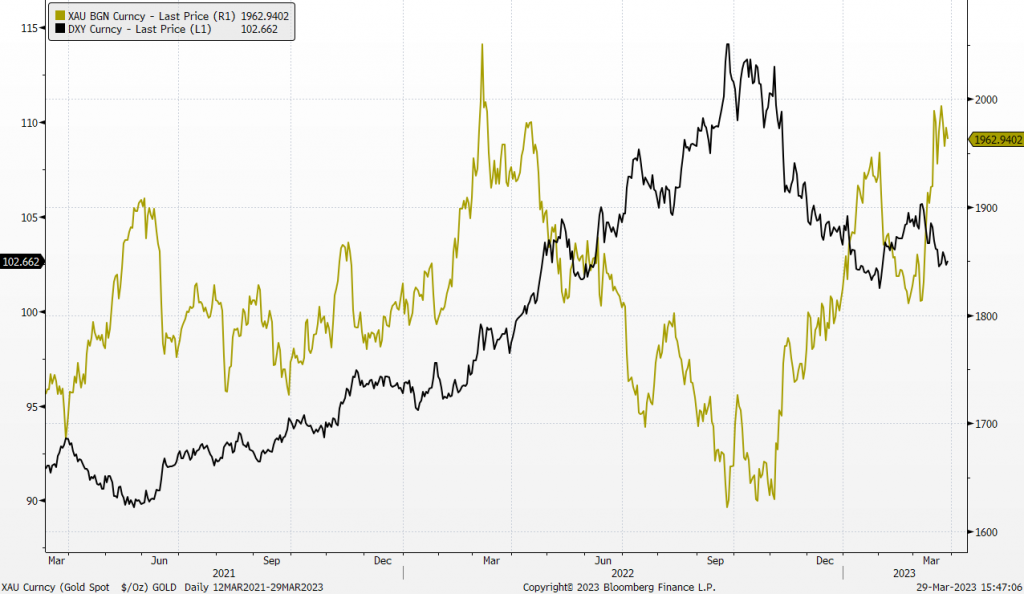
(Source: Bloomberg)
(Source: Bloomberg)

| Fund Name (Ticker) | Global X Silver Miners ETF (SIL US) |
| Description | The Global X Silver Miners ETF (SIL) seeks to provide investment results that correspond generally to the price and yield performance, before fees and expenses, of the Solactive Global Silver Miners Total Return Index. |
| Asset Class | Equity |
| 30-Day Average Volume (as of 7 Mar) | 412,869 |
| Net Assets of Fund (as of 27 Mar) | USD$962,660,000 |
| 12-Month Trailing Yield (as of 28 Mar) | -15.62% |
| P/E Ratio (2022/2023) (as of 27 Mar) | 49.74/ 29.91 |
| P/B Ratio (2022/2023) (as of 27 Mar) | 1.54/ 1.50 |
| Management Fees | 0.65% |
Top 10 Holdings
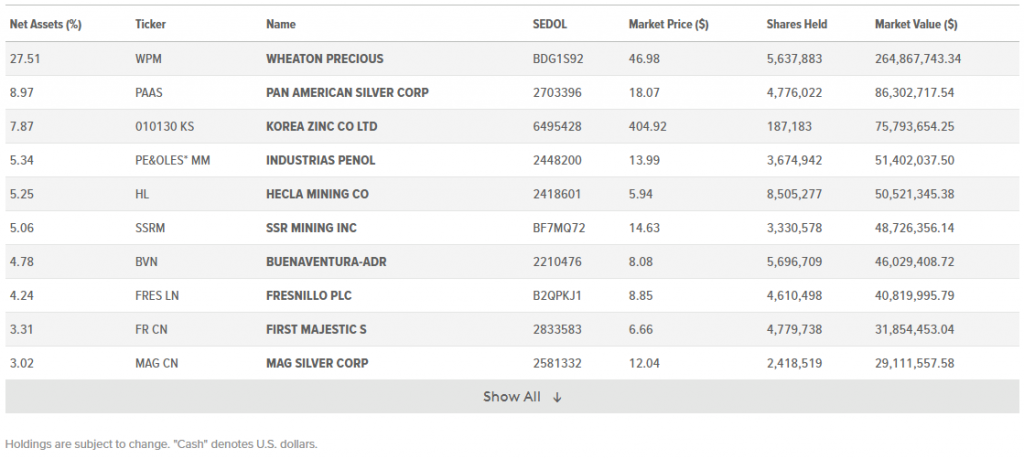
(as of 27 Mar 2023)

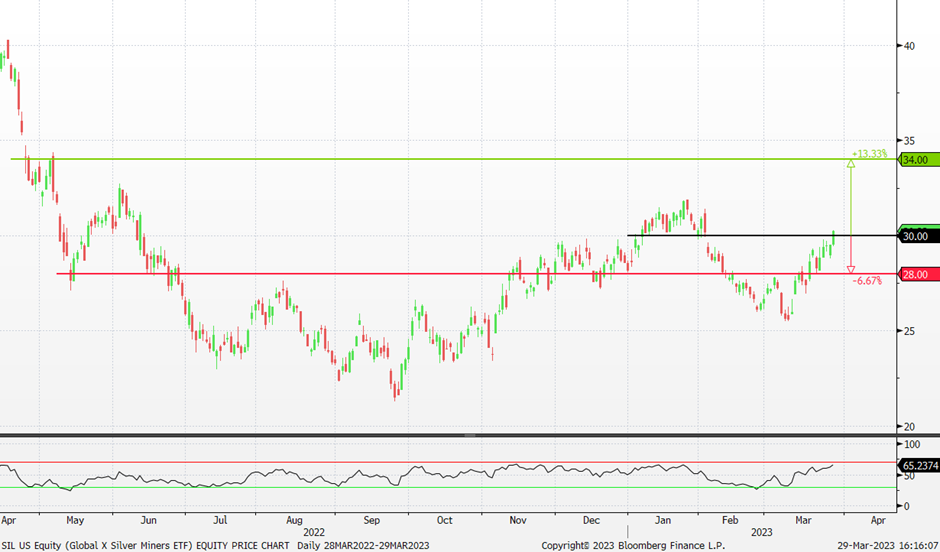
- BUY Entry – 30.0 Target – 34.0 Stop Loss – 28.0
- Turning towards safer assets. With the ongoing rate hikes amidst the harsh macro economic environment, consumer sentiments are turning towards safer assets such as gold, silver, as well as other instruments like bonds. This is further accelerated from the recent SVB banking crisis which led to a huge downturn for the banking industry, with consumers withdrawing huge amount of cash from banks with the fears that they might lose their money.
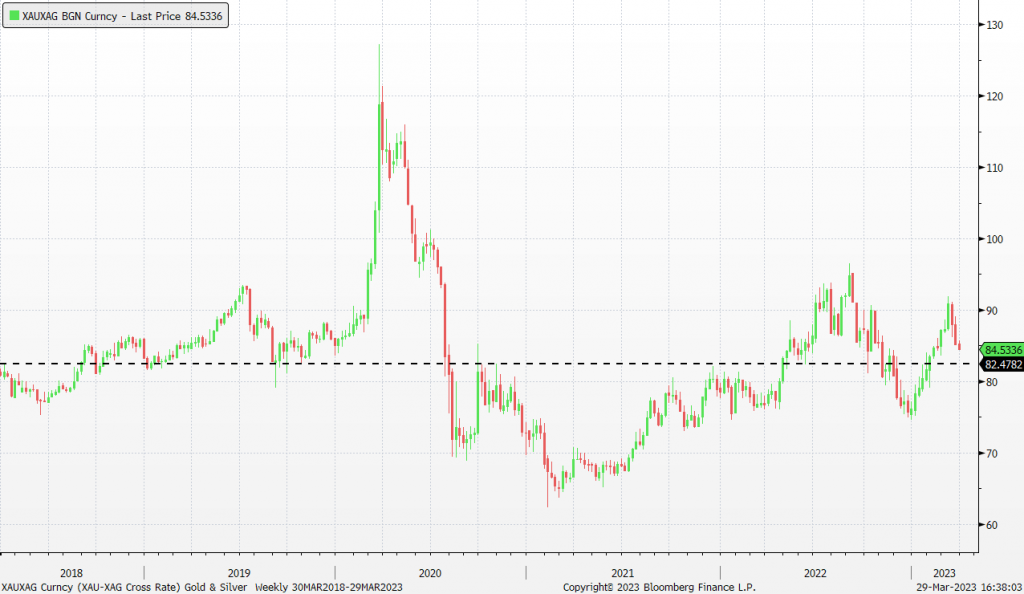
- Lagging Silver Prices. Recently, silver prices performance has been lagging behind Gold price performance and is bound to catch up. The current gold/silver ratio is currently trading at around 84.5 whereas the 5 years average gold/silver ratio is around 82.5. This difference is expected to close up in the near term.
Gold/Silver ratio
- Better Outlook for Silver and Gold. There are several factors that impact gold and silver prices, and the key ones are the trend of the US dollar and global geopolitical risk. The broad market has expected that US dollars peaked last year as inflation has been on a downswing. Even though recent macro data such as CPI and core PCE prices showed overall prices were declining. The US job market started showing some weaknesses as the unemployment rate rose to 3.6% in February. The market expects Fed to cut rates in 2H23. On the other hand, geopolitical tensions remain high and probably escalate anytime as China-US confrontations are more frequent
Silver Price and Dollar Index Trend
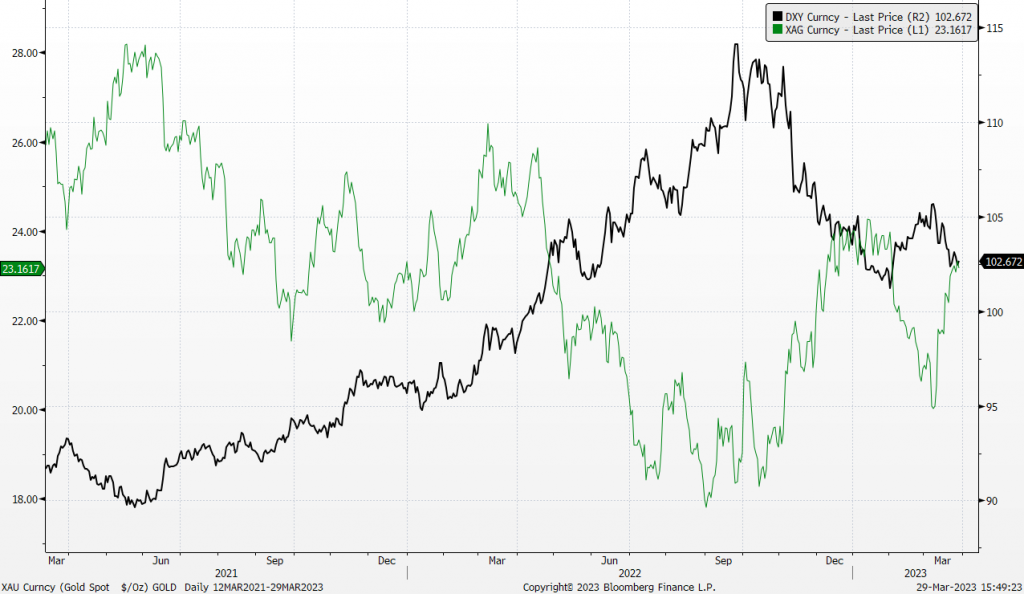
(Source: Bloomberg)