18 March 2025: Futures Product Ideas
KGI Weekly Futures Update
SGX TSI Iron Ore CFR China (62% Fe Fines) Index Futures
Net Long/Short and Price Comparison
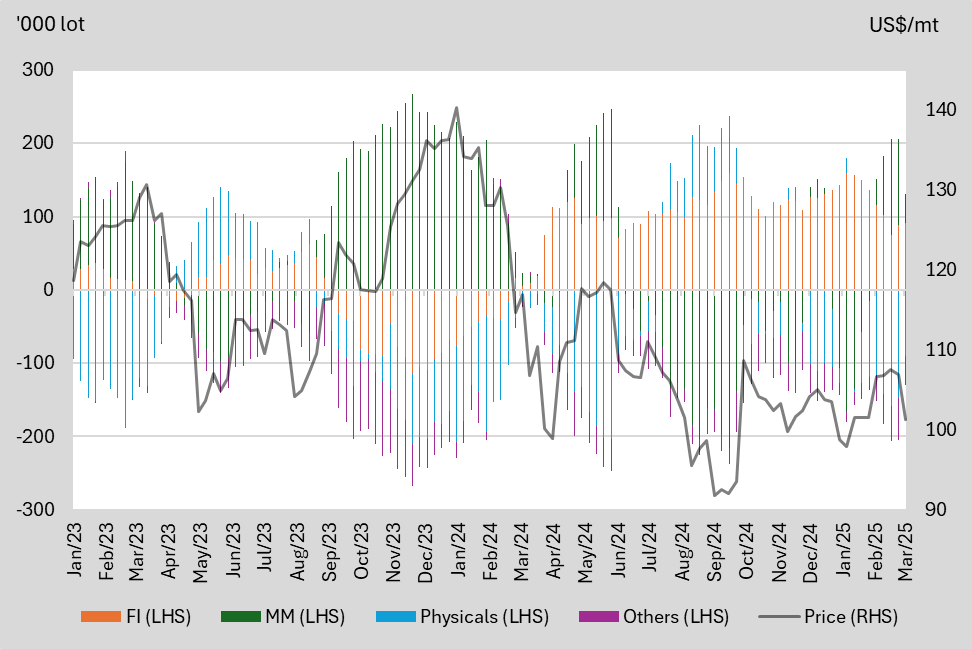
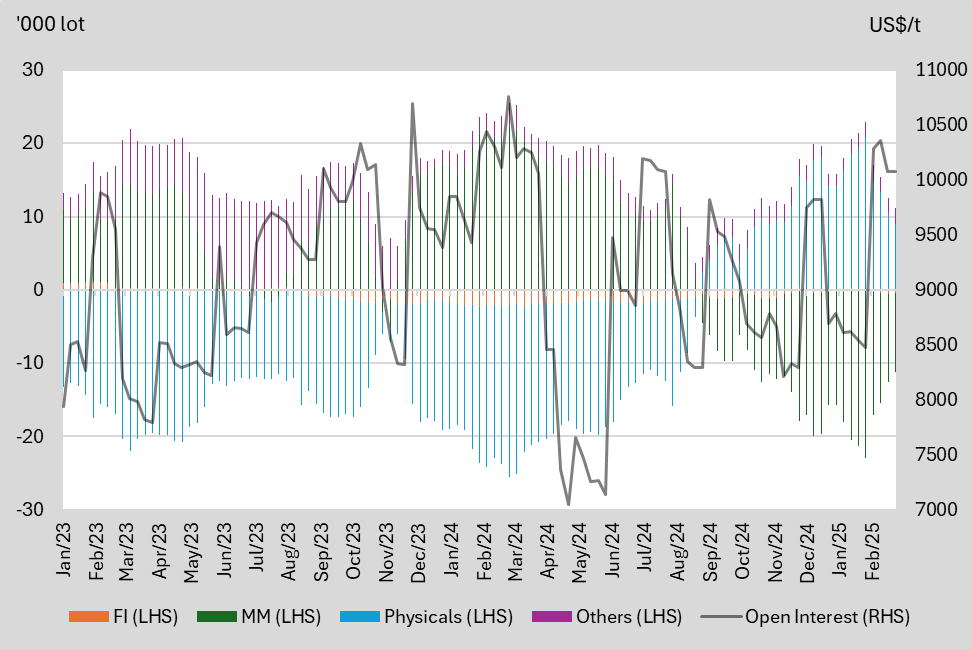
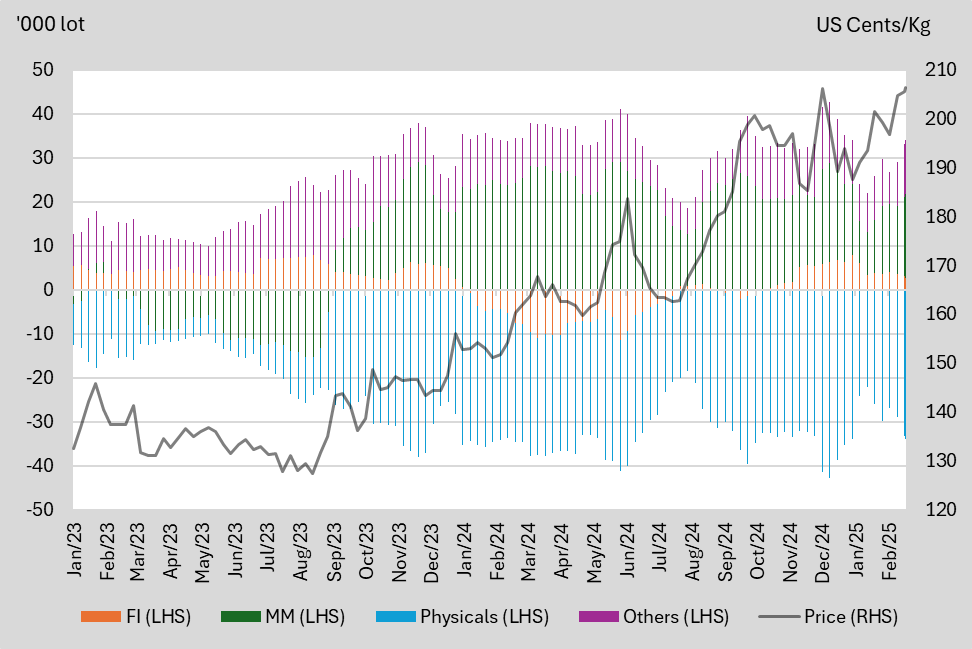
We highlight the key price levels that each participant switches their positions between net long and net short based on 2024 data.
2024 | Financial Institution (FI) | Manage Money (MM) | Physicals | Others |
Net Long | Below US$118/mt | Above US$118/mt | Below US$100/mt | NA |
Net Short | Above US$118/mt | Below US$115/mt | Above US$100/mt | NA |
Net-position WoW Change | Remarks | |
FI | +3.77 | Increase for 2 consecutive weeks |
MM | -78.7 | Decline for 2 consecutive weeks, largest decline since the start of the year |
Physicals | +57.1 | Increase for 2 consecutive weeks, largest increase since the start of the year |
Others | +17.8 | Rebound after 4 consecutive weeks of decline |
Figure 1: Net-positions by participant segment and price comparison
Source: SGX, KGI Research
Long/Short Traders Snapshot
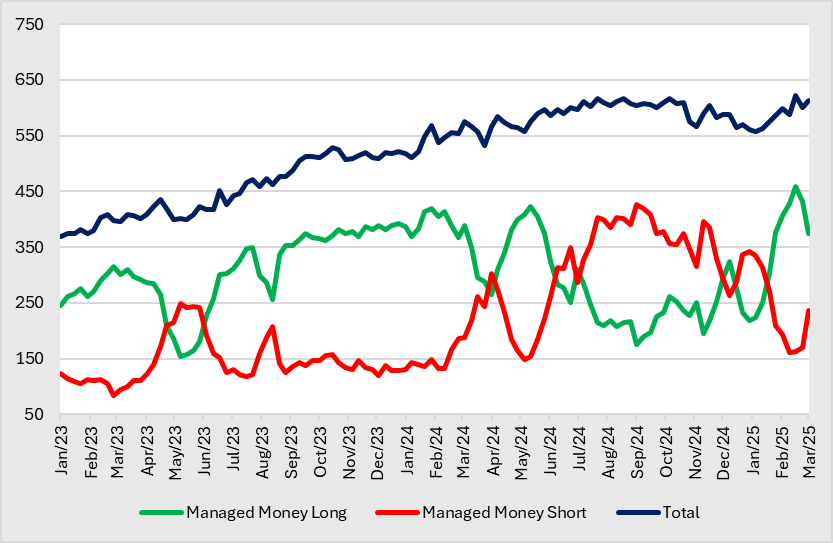
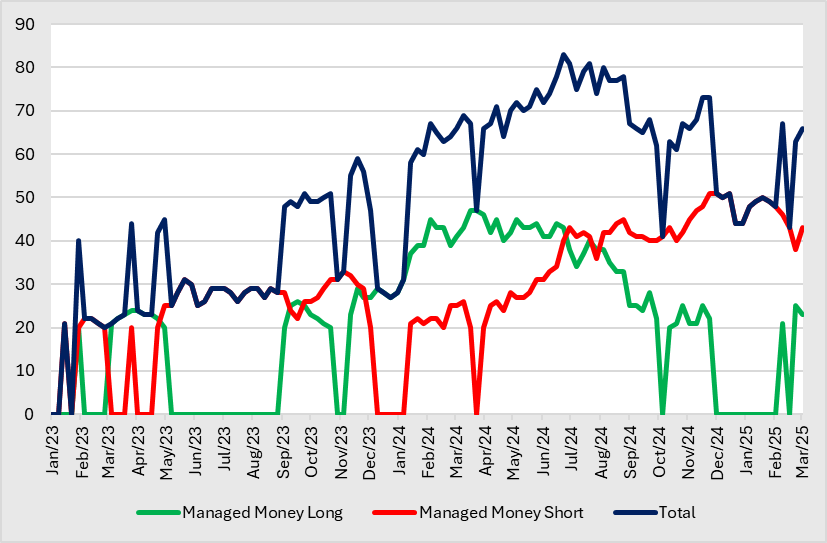
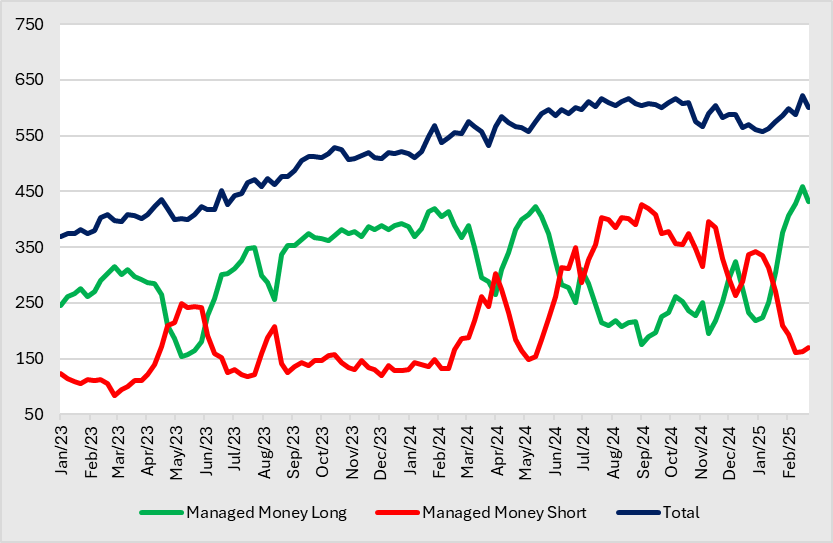
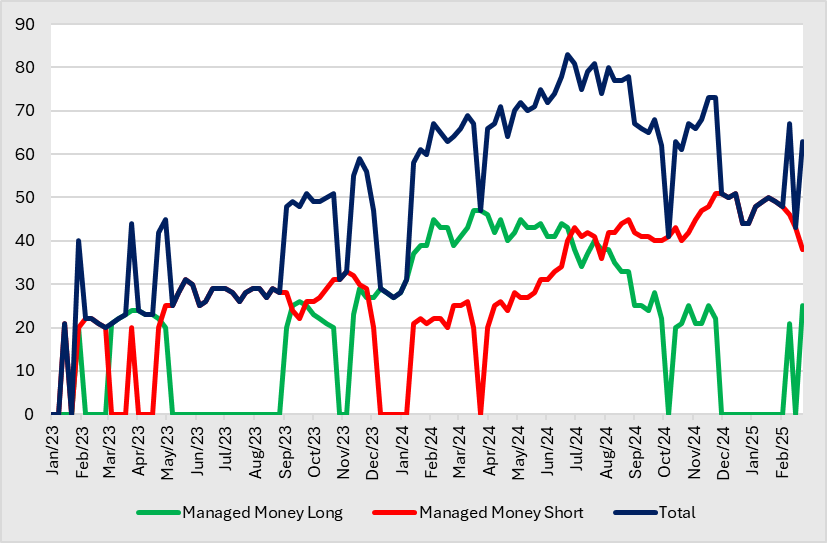
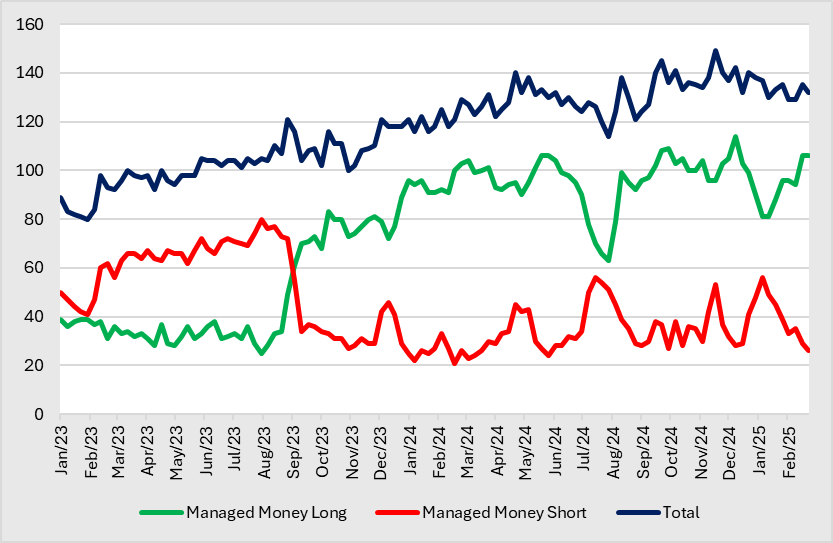
- Managed Money. The number of MM with long positions declined for 2 consecutive weeks to 375 after reaching a high of 459 two weeks ago. Accordingly, the number of MM with short positions rose for three consecutive weeks to 237. Seasonally, More MMs are prone to long in 1HQ4 and 2HQ2, and there are more MMs with short positions in 1HQ2 and 1HQ3.
2024 | 2023 | |||
Long | Short | Long | Short | |
High | 423 | 427 | 393 | 248 |
Low | 176 | 131 | 154 | 83 |
Figure 2: Number of position holders iron ore futures
Source: SGX, KGI Research
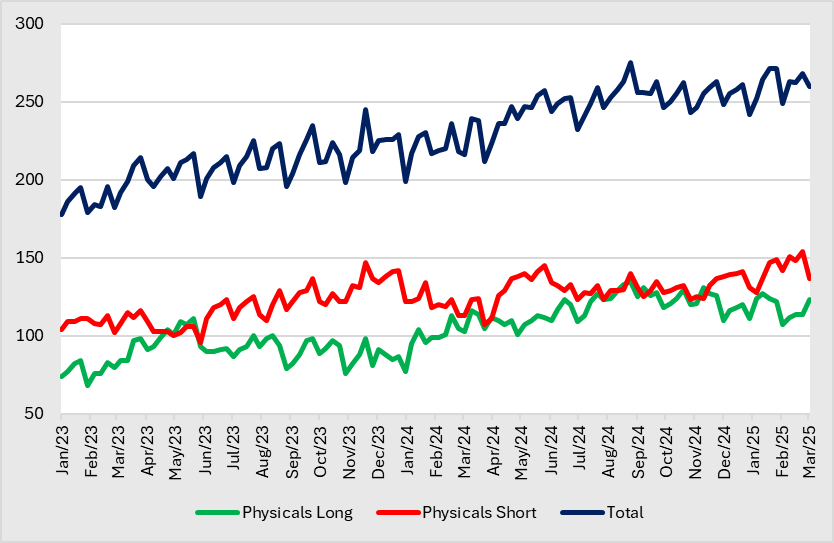
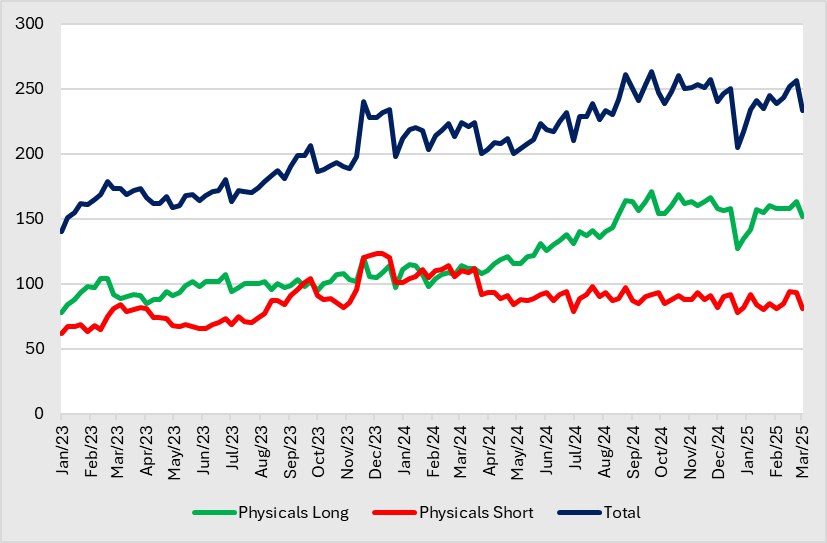
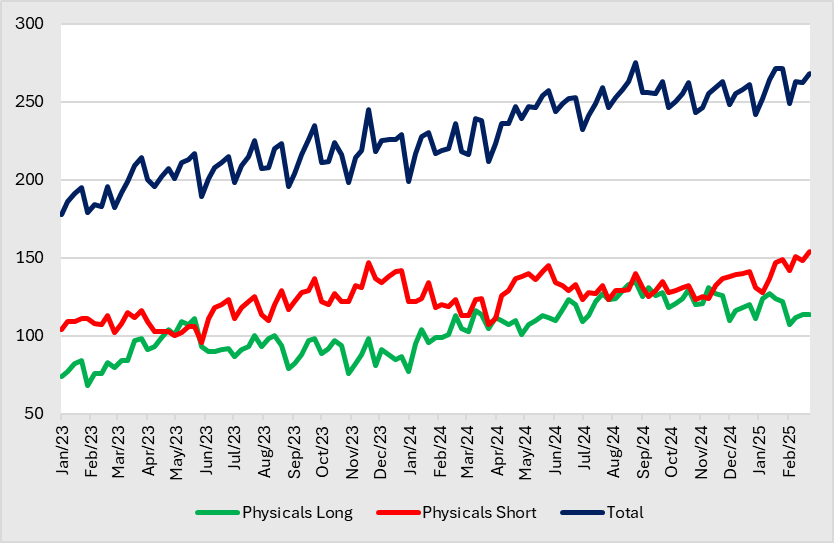
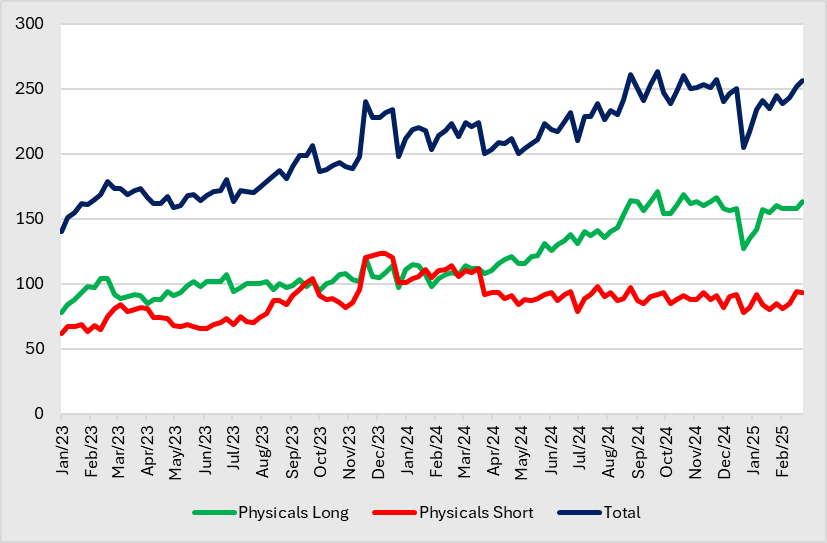
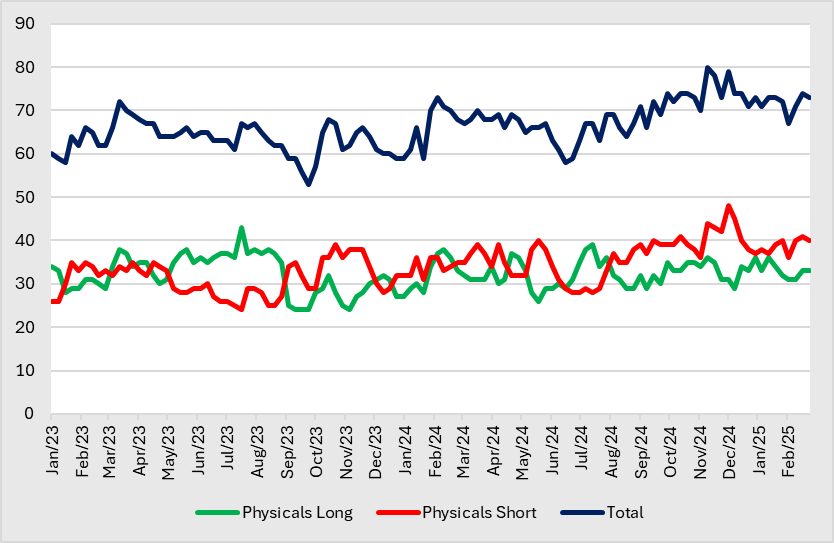
- Physicals. The number of physicals with long positions increased to 123 after remaining stable a week ago. Accordingly, the number of physicals with short positions retreated to 137, after reaching a high in over 2 years at 154 a week ago. Seasonally, more physicals are prone to being long in 1Q, and there are more physicals with short positions in Q4.
2024 | 2023 | |||
Long | Short | Long | Short | |
High | 135 | 145 | 111 | 147 |
Low | 77 | 107 | 68 | 96 |
Figure 3: Number of position holders iron ore futures
Source: SGX, KGI Research
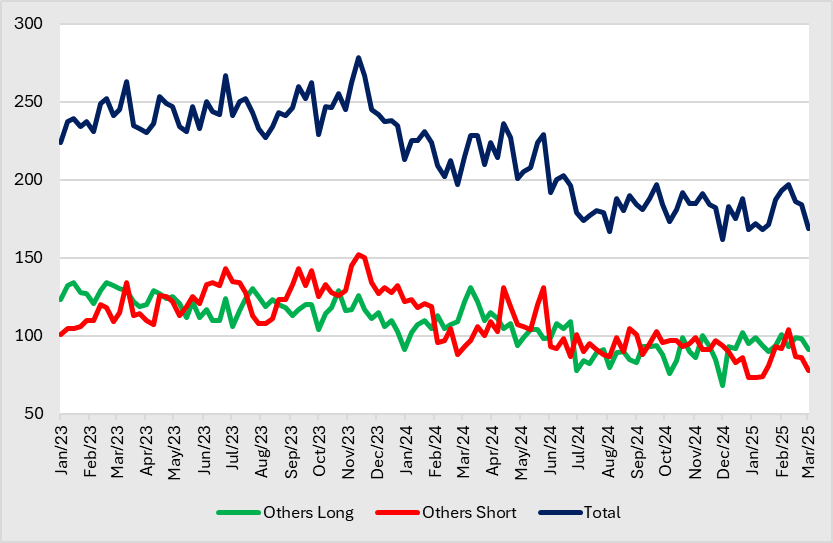
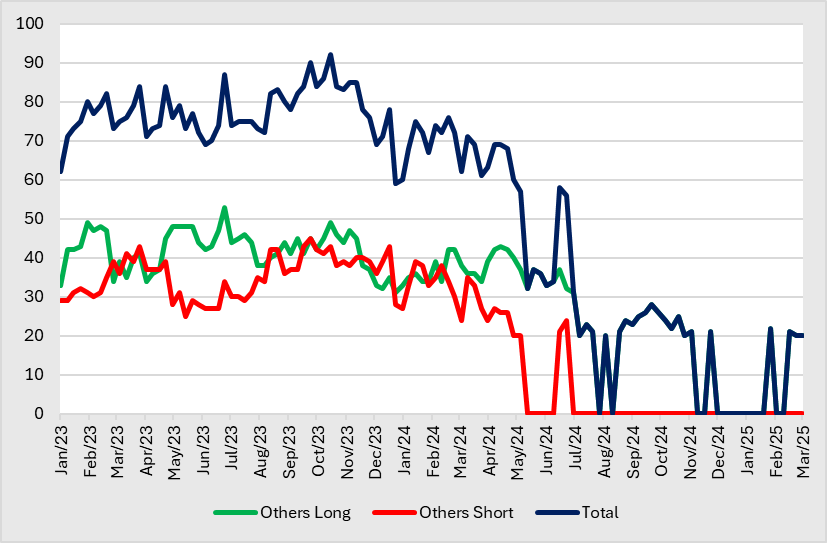
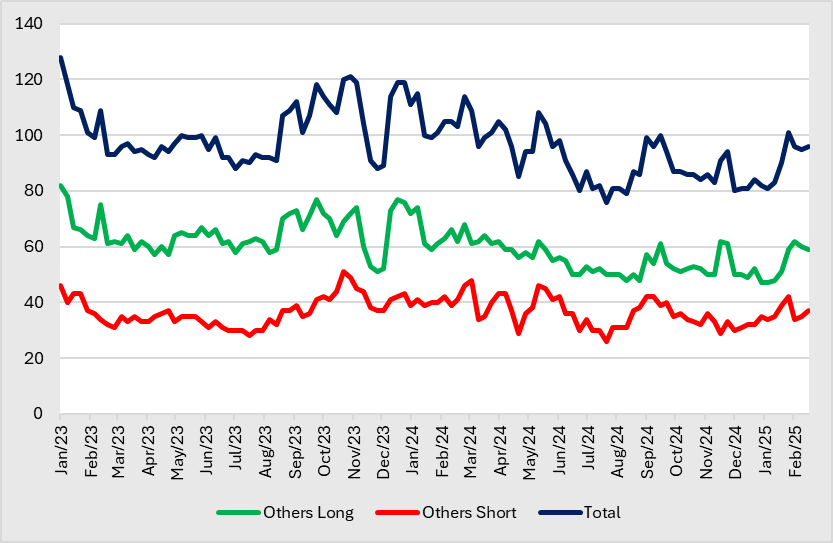
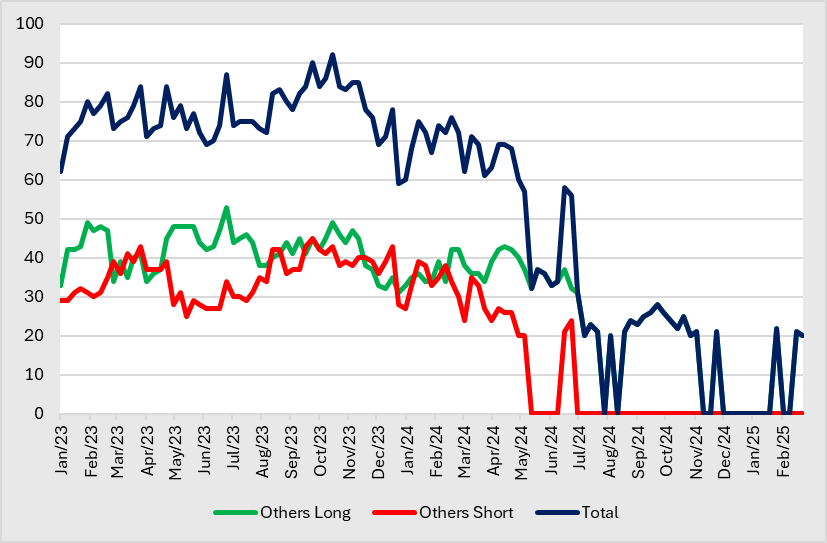
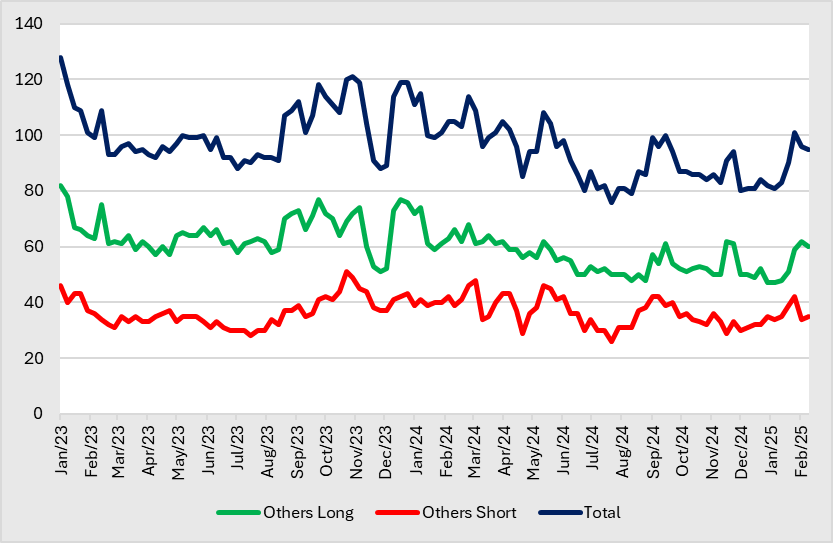
- Others. The number of others with long positions retreated for two consecutive weeks to 91, while the number of others with short positions retreated even further for three consecutive weeks to 78.
2024 | 2023 | |||
Long | Short | Long | Short | |
High | 131 | 131 | 134 | 152 |
Low | 68 | 83 | 103 | 101 |
Figure 4: Number of position holders iron ore futures
Source: SGX, KGI Research
SGX Baltic Panamax Time Charter Average Futures
We highlight the key price levels that each participants switches their positions between net long and net short based on 2024 data.
2024 | Financial Institution (FI) | Manage Money (MM) | Physicals | Others |
Net Long | NA | Above US$9,000/t | Below US$8,500/t | NA |
Net Short | NA | Below US$9,000/t | Above US$9,500/t | NA |
Net-position WoW Change | Remarks | |
FI | +0.06 | Increase for 2 consecutive weeks |
MM | +2.57 | Increase for 5 consecutive weeks |
Physicals | -2.67 | Decline for 5 consecutive weeks |
Others | +0.04 | Increase for 2 consecutive weeks |
Figure 5: Net-positions by participant segment and price comparison

Source: SGX, KGI Research
Long/Short Traders Snapshot
- Managed Money. The number of MM with long positions decreased slightly to 23 at the start of March. On the other hand, the number of MM with short positions rebounded to 43 after 5 consecutive weeks of decline. Seasonally, More MM are prone to long in 1H, and there are more MM with short positions in 2H.
2024 | 2023 | |||
Long | Short | Long | Short | |
High | 47 | 51 | 29 | 33 |
Low | 20 | 20 | 20 | 20 |
Figure 6: Number of position holders freight futures
Source: SGX, KGI Research
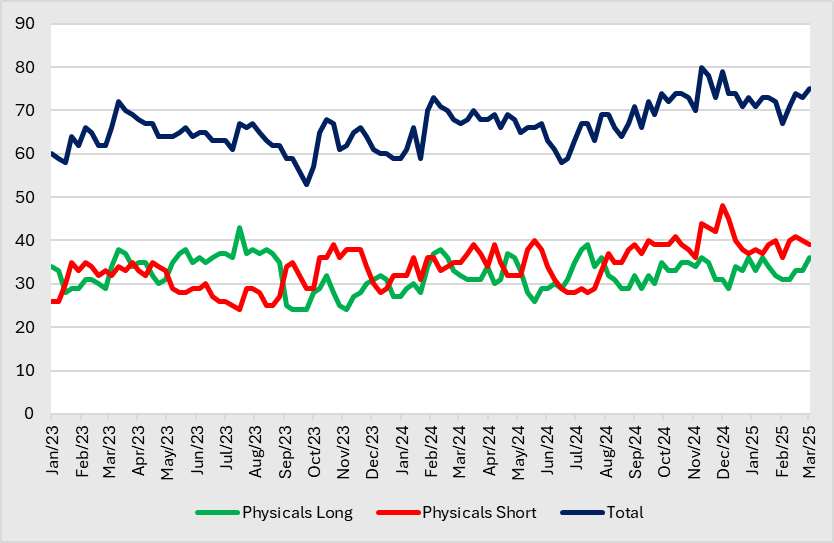
- Physicals. The number of physicals with long positions retreated to 152 after reaching a high since November 2024 last week. Accordingly, the number of physicals with short positions retreated for 2 consecutive weeks to 81, after reaching a high since August 2024 at 94 two weeks ago. The number of physicals has been on a general upward trend since 2Q, while physicals with short positions generally saw a downtrend since 2Q.
2024 | 2023 | |||
Long | Short | Long | Short | |
High | 171 | 114 | 120 | 123 |
Low | 98 | 78 | 78 | 62 |
Figure 7: Number of position holders freight futures
Source: SGX, KGI Research
- Others. The number of others with long positions remained stable at 20 at the start of March.
2024 | 2023 | |||
Long | Short | Long | Short | |
High | 43 | 39 | 53 | 45 |
Low | 20 | 20 | 31 | 25 |
Figure 8: Number of position holders freight futures
Source: SGX, KGI Research
SGX SICOM Rubber Futures – TSR20
Net Long/Short and Price Comparison
We highlight the key price levels that each participants switches their positions between net long and net short based on 2024 data.
2024 | Financial Institution (FI) | Manage Money (MM) | Physicals | Others |
Net Long | Below US$1.90/kg | NA | NA | NA |
Net Short | Above US$1.60/kg | NA | NA | NA |
Net-position WoW Change | Remarks | |
FI | +0.17 | Rebound from decline for 3 consecutive weeks |
MM | -1.03 | Retreat from increase for 2 consecutive weeks |
Physicals | +3.33 | Rebound from decline for 3 consecutive weeks |
Others | -2.48 | Retreat from increase for 3 consecutive weeks |
Figure 9: Net-positions by participant segment and price comparison

Source: SGX, KGI Research
Long/Short Traders Snapshot
- Managed Money. The number of MM with long positions remained stable for 2 consecutive weeks at 106, with a general uptrend since the start of 2025. Accordingly, the number of MM with short positions rebounded to 28 after 2 consecutive weeks of decline but still maintained a general downtrend since the start of 2025.
2024 | 2023 | |||
Long | Short | Long | Short | |
High | 114 | 56 | 89 | 80 |
Low | 63 | 21 | 25 | 27 |
Figure 10: Number of position holders rubber futures

Source: SGX, KGI Research
- Physicals. The number of physicals with long positions increased to 36 after remaining stable a week ago, reaching back to its high since the start of the year. Accordingly, the number of physicals with short positions retreated marginally for 2 consecutive weeks to 39, with little deviations since the end of 2024. Seasonally, more physicals are prone to long in early Q3, and there are more physicals with short positions in Q4.
2024 | 2023 | |||
Long | Short | Long | Short | |
High | 39 | 48 | 43 | 39 |
Low | 26 | 28 | 24 | 24 |
Figure 11: Number of position holders rubber futures
Source: SGX, KGI Research
- Others. The number of long holders declined for 2 consecutive weeks to 59 after reaching a high in early December 2024 two weeks ago. On the other hand, the number of short holders increased for 2 consecutive weeks to 37.
2024 | 2023 | |||
Long | Short | Long | Short | |
High | 77 | 48 | 82 | 51 |
Low | 48 | 26 | 51 | 28 |
Figure 12: Number of position holders rubber futures
Source: SGX, KGI Research
Participant Category | Description |
Financial Institutions | An entity, such as a broker trading desk, bank trading desk or swap dealer, that uses the futures markets to manage or hedge the risk. |
Managed Money | An entity that is engaged in organized futures trading on behalf of funds or other special investment purpose vehicles such as Pension Funds, Asset Managers, Hedge Funds, Proprietary Trading Groups, Family Offices, etc. |
Physicals | An entity that predominantly engages in the physical markets and uses the futures markets to manage or hedge risks associated with the conduct of those activities. Such activities could include the production, processing, trading, packing or handling of a physical commodity, or the provision of transportation, warehousing or distribution services. |
Others | Every other trader that is not placed into one of the other three categories. E.g., Broker Agency, Bank Agency, Inter-Dealer Brokers, etc. |
凯基证券期货周报 – 3 月 11 日
SGX TSI 铁矿石 CFR 中国(62% 铁粉)指数期货
净多头/空头和价格比较
我们根据2024年数据,突出了每个参与者在净多头和净空头之间切换仓位的关键价格水平。
2024 | 金融机构 (FI) | 管理资金 (MM) | 实物交易(Physicals) | 其他 (Others) |
净多头 | 低于 118 美元/吨 | 118 美元/吨以上 | 低于 100 美元/吨 | 无 |
净空头 | 118 美元/吨以上 | 低于 115 美元/吨 | 100 美元/吨以上 | 无 |
净仓位按周变化 | 备注 | |
金融机构 | +3.77 | 连续两周增加 |
管理资金 | -78.7 | 连续两周下跌,为年初以来最大跌幅 |
实物交易 | +57.1 | 连续两周增长,是自年初以来的最大增幅 |
其他 | +17.8 | 在连续4周下跌后反弹 |
图 1:按参与者细分的净持仓和价格比较

资料来源: 新交所、凯基研究
多头/空头交易简报
- 管理资金。持有多头头寸的管理资金数目从两周前的459降至375,连续两周下降。因此,持有空头头寸的管理资金数目连续3周增加,达到237人季节性来看,更多管理资金倾向于在第四季上半旬和第二季下半旬持有多头,而在第二季上半旬和第三季上半旬持有空头的管理资金较多。
2024 | 2023 | |||
看多 | 看空 | 看多 | 看空 | |
最高值 | 423 | 427 | 393 | 248 |
最低值 | 176 | 131 | 154 | 83 |
图 2:铁矿石期货持仓者数量
资料来源: 新交所、凯基研究
- 实物交易。 在一周前保持稳定的情况下,持有多头头寸的实物交易增加到了123家。因此,持有空头头寸的实物投资者数量从一周前2年多以来的高位154个减少到137家。季节性来看,更多实物交易倾向于在第一季度持有多头,而在第四季度持有空头的实物交易较多。
2024 | 2023 | |||
看多 | 看空 | 看多 | 看空 | |
最高值 | 135 | 145 | 111 | 147 |
最低值 | 77 | 107 | 68 | 96 |
图 3:铁矿石期货持仓者数量
资料来源: 新交所、凯基研究
- 其他。 持有多头头寸的其他交易连续2周回落至91家,而持有空头头寸连续3周进一步回落至78家。
2024 | 2023 | |||
看多 | 看空 | 看多 | 看空 | |
最高值 | 131 | 131 | 134 | 152 |
最低值 | 68 | 83 | 103 | 101 |
图 4:铁矿石期货持仓者数量

资料来源: 新交所、凯基研究
SGX 波罗的海巴拿马型船平均期租期货
我们根据2024年数据,突出了每个参与者在净多头和净空头之间切换仓位的关键价格水平。
2024 | 金融机构 (FI) | 管理资金 (MM) | 实物交易(Physicals) | 其他 (Others) |
净多头 | 无 | 9,000 美元/吨以上 | 低于 8,500 美元/吨 | 无 |
净空头 | 无 | 低于 9,000 美元/吨 | 9,500 美元/吨以上 | 无 |
净仓位按周变化 | 备注 | |
金融机构 | +0.06 | 连续两周增加 |
管理资金 | +2.57 | 连续5周增加 |
实物交易 | -2.67 | 连续5周下降 |
其他 | +0.04 | 连续两周增加 |
图 5:按参与者类别划分的净仓位及价格比较
资料来源: 新交所、凯基研究
多头/空头交易者快照
- 管理资金。3月初,持有多头头寸的管理资金数量略有减少,为23家。另一方面,持有空头头寸的管理资金数量在连续5周下降后反弹至43。季节性来看,更多管理资金倾向于在上半年持有多头,而在下半年持有空头的管理资金较多。
2024 | 2023 | |||
看多 | 看空 | 看多 | 看空 | |
最高值 | 47 | 51 | 29 | 33 |
最低值 | 20 | 20 | 20 | 20 |
图 6: 运费期货持仓者数量
资料来源: 新交所、凯基研究
- 实物交易。 在上周达到2024年11月以来的最高水平后,持有多头头寸的实体投资者数量回落至152家。因此,在两周前达到2024年8月以来的最高值(94个)后,连续两周减少至81家。自去年第二季度以来,实物交易数量总体呈上升趋势,而持有空头头寸的实物交易数量自去年第二季度以来总体呈下降趋势。
2024 | 2023 | |||
看多 | 看空 | 看多 | 看空 | |
最高值 | 171 | 114 | 120 | 123 |
最低值 | 98 | 78 | 78 | 62 |
图 7: 运费期货持仓者数量
资料来源: 新交所、凯基研究
- 其他。 3月初,其他持有多头头寸的公司数量稳定在20家。
2024 | 2023 | |||
看多 | 看空 | 看多 | 看空 | |
最高值 | 43 | 39 | 53 | 45 |
最低值 | 20 | 20 | 31 | 25 |
图 8: 运费期货持仓者数量
资料来源: 新交所、凯基研究
SGX SICOM 橡胶期货 – TSR20
净多头/空头及价格比较
我们根据2024年数据,突出了每个参与者在净多头和净空头之间切换仓位的关键价格水平。
2024 | 金融机构 (FI) | 管理资金 (MM) | 实物交易(Physicals) | 其他 (Others) |
净多头 | 低于 1.90 美元/公斤 | 无 | 无 | 无 |
净空头 | 1.60 美元/公斤以上 | 无 | 无 | 无 |
净仓位按周变化 | 备注 | |
金融机构 | +0.17 | 连续三周的下跌后反弹 |
管理资金 | -1.03 | 连续两周上升后回落 |
实物交易 | +3.33 | 连续三周下降后反弹 |
其他 | -2.48 | 连续三周上升后回落 |
图 9:按参与者类别划分的净仓位及价格比较
资料来源: 新交所、凯基研究
多头/空头交易者快照
- 管理资金。 持有多头头寸的管理资金数量连续两周保持稳定,为106,自2025年初以来总体呈上升趋势。相应的,持有空头头寸的管理资金数量在连续两周下降后反弹至28个,但仍保持了2025年初以来的总体下降趋势。
2024 | 2023 | |||
看多 | 看空 | 看多 | 看空 | |
最高值 | 114 | 56 | 89 | 80 |
最低值 | 63 | 21 | 25 | 27 |
图 10:橡胶期货持仓者数量
资料来源:新交所、凯基研究
- 实物交易者。持有多头头寸的实物交易数量在一周前保持稳定后,增至36家,回到了年初以来的高点。因此,持有空头头寸的实物交易连续两周小幅回落至39家,自2024年底以来几乎没有变化。季节性来看,更多实物交易倾向于在第三季度初持有多头,而在第四季度持有空头的实物交易较多。
2024 | 2023 | |||
看多 | 看空 | 看多 | 看空 | |
最高值 | 39 | 48 | 43 | 39 |
最低值 | 26 | 28 | 24 | 24 |
图11:橡胶期货持仓者数量
资料来源:新交所、凯基研究
- 其他。 在两周前达到2024年12月初的高点后,多头持有者的数量连续两周下降至59家。另一方面,空头持仓数量连续两周增加,达到37家。
2024 | 2023 | |||
看多 | 看空 | 看多 | 看空 | |
最高值 | 77 | 48 | 82 | 51 |
最低值 | 48 | 26 | 51 | 28 |
图 12:持仓橡胶期货数量
资料来源:新交所、凯基研究
参与者类别 | 描述 |
金融机构 | 使用期货市场管理或对冲风险的实体,如经纪商交易台、银行交易台或互换交易商。 |
管理资金 | 代表基金或其他特殊投资目的工具(如养老基金、资产管理公司、对冲基金、自营交易集团、家族办公室等)从事有组织的期货交易的实体。 |
实物交易 | 主要从事实物市场并使用期货市场管理或对冲与这些活动相关风险的实体。这些活动可能包括生产、加工、贸易、包装或处理实物商品,或提供运输、仓储或分销服务。 |
其他 | 未归类到上述三类中的其他交易者,例如经纪代理、银行代理、交易商间经纪商等。 |