
2 May 2024: Wealth Product Ideas

Energy Sector
- The U.S. may see a shortage in power as the demand for power increases alongside the demand for AI. Power infrastructure is expected to expand even further to cater to this heightened demand. I.E. More data centers are required to cater to the demand of AI; Large language models are also very energy-intensive because they require a lot of computational power.
- AI development and use requires a lot of energy, especially for data centers. The utilities sector is poised for growth due to the surge in demand for electricity from AI. Investors are looking at utilities as an alternative way to invest in the AI boom.
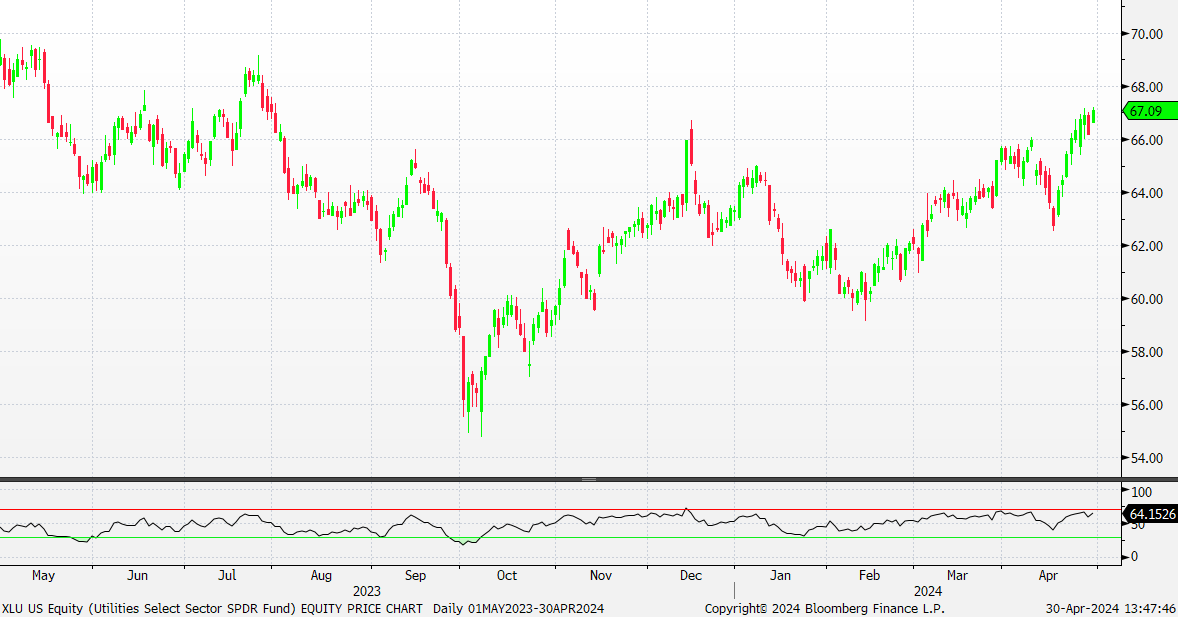
Fund Name (Ticker) | Utilities Select Sector SPDR Fund (XLU US) |
Description | The Utilities Select Sector SPDR® Fund seeks to provide investment results that, before expenses, generally correspond to the price and yield performance of the Utilities Select Sector Index. |
Asset Class | Equity |
30-Day Average Volume (as of 29 Apr) | 14,203,359 |
Net Assets of Fund (as of 26 Apr) | USD11,877.04mn |
12-Month Yield (as of 26 Apr) | 3.29% |
P/E Ratio (as of 26 Apr) | 18.25 |
P/B Ratio (as of 26 Apr) | 1.97 |
Management Fees (Annual) | 0.09% |
Top 10 Holdings
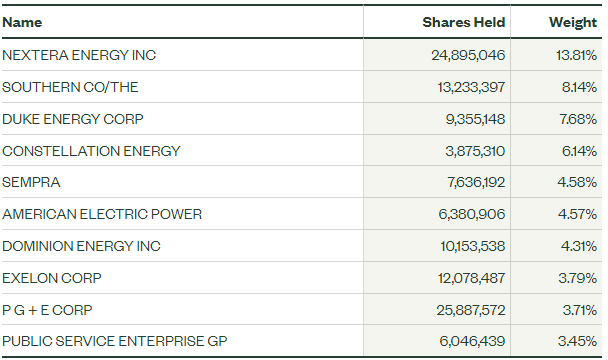
(as of 26 April 2024)

(Source: Bloomberg)

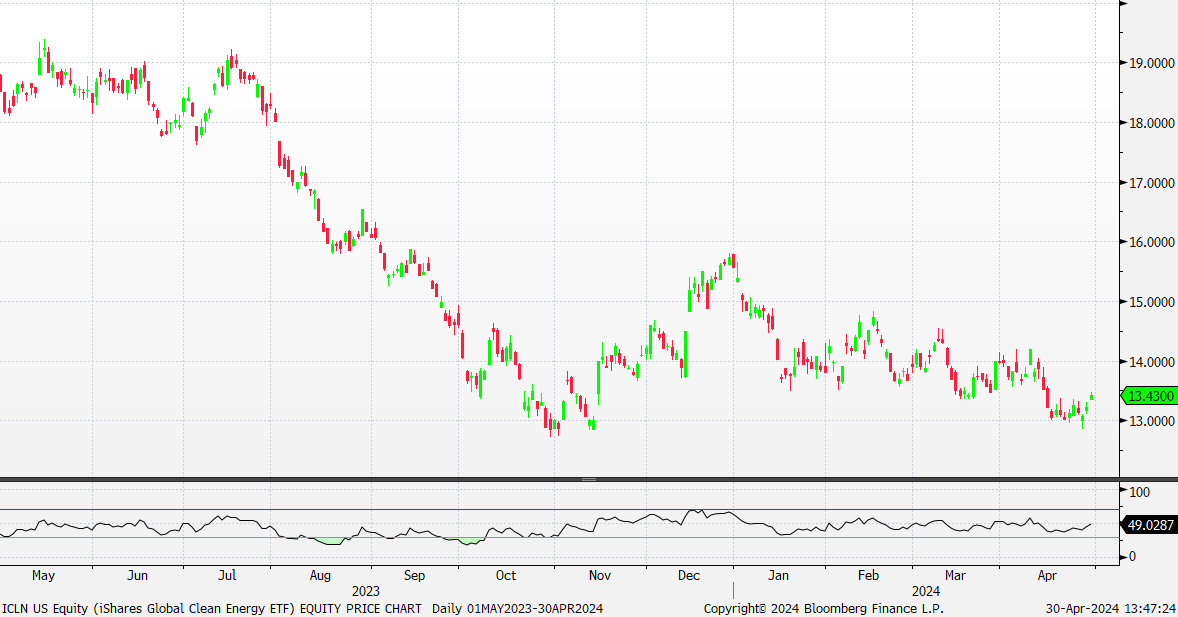
Fund Name (Ticker) | iShares Global Clean Energy ETF (ICLN US) |
Description | The iShares Global Clean Energy ETF seeks to track the investment results of an index composed of global equities in the clean energy sector. |
Asset Class | Equity |
30-Day Average Volume (as of 26 Apr) | 3,931,624 |
Net Assets of Fund (as of 29 Apr) | US$2,197,747,009 |
12-Month Trailing Yield (as of 31 Mar) | 1.77% |
P/E Ratio (as of 26 Apr) | 16.42 |
P/B Ratio (as of 26 Apr) | 1.57 |
Management Fees (Annual) | 0.41% |
Top 10 Holdings
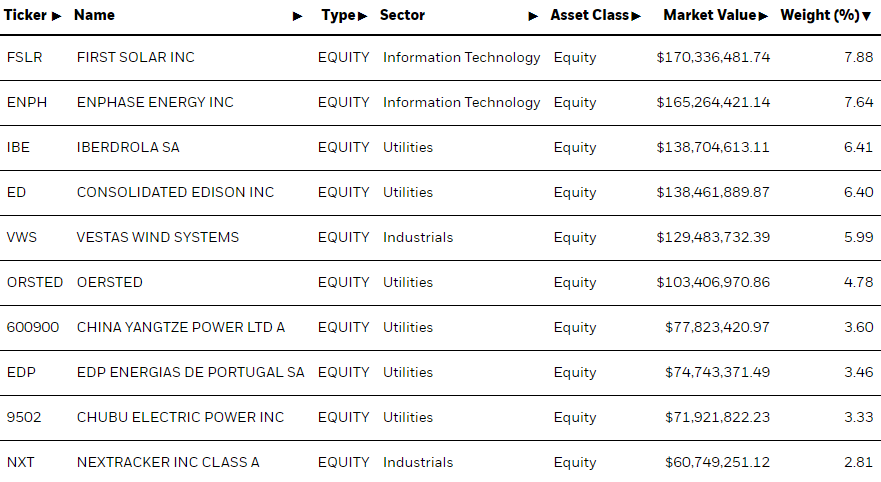
(as of 26 April 2024)

(Source: Bloomberg)