6 March 2025: Investment Product Ideas

Market Remains Volatile, Enhancing with Covered Calls and Low-Vol Strategies
- The current market environment is marked by heightened uncertainty, geopolitical tensions, and fluctuating economic indicators, making traditional investment strategies increasingly challenging. Persistent volatility has become a defining feature, underscoring the need for approaches that emphasize capital preservation and consistent income generation. In this context, covered call writing strategies and low-volatility ETFs present compelling solutions. Covered calls provide a way to generate steady income while offering some downside protection, while low-volatility ETFs help mitigate risk by focusing on stable, less volatile assets. By integrating these strategies, investors can build a resilient portfolio that not only navigates market turbulence but also delivers stable returns, making them well-suited for the current unpredictable macroeconomic conditions.
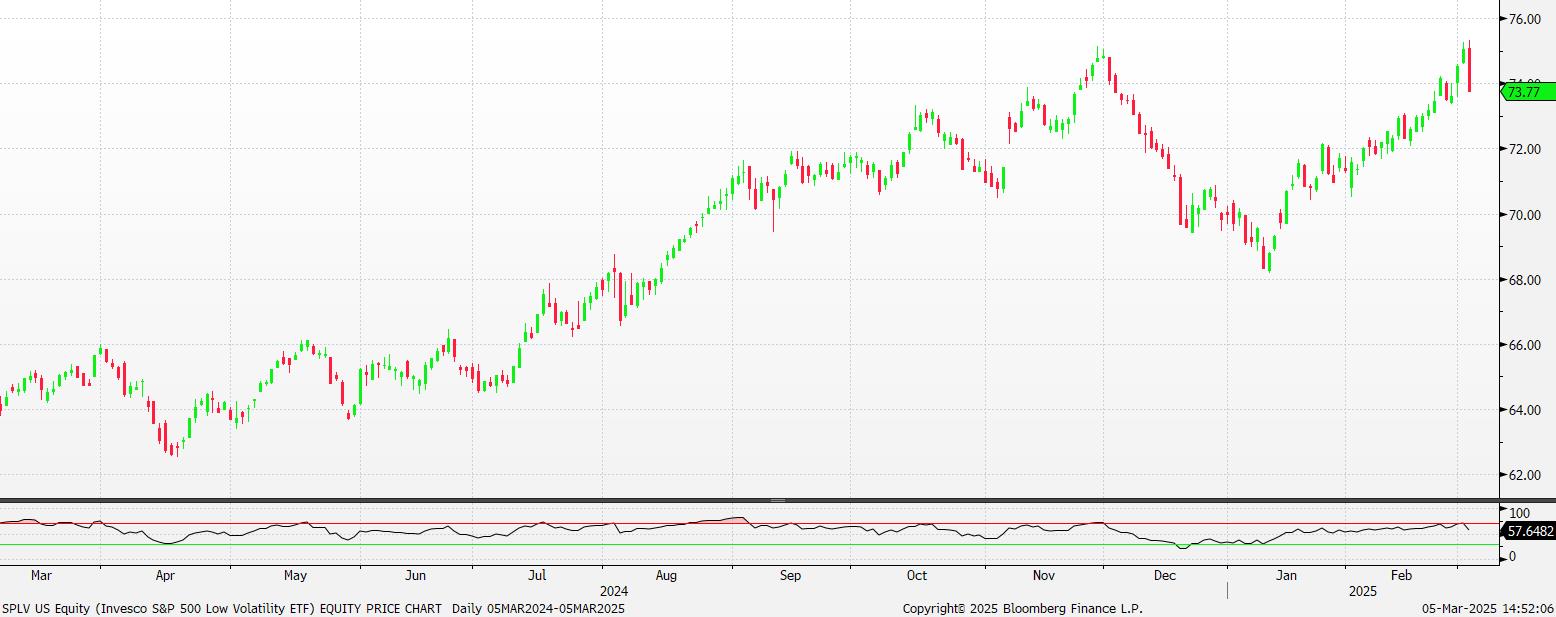
Invesco S&P 500 Low Volatility ETF (SPLV US)
- Low Volatility
This ETF tracks an index that selects and holds at least 100 of the lowest-volatility stocks within the S&P 500, resulting in a relatively stable performance during market fluctuations. - Inverse Volatility Weighting
The ETF employs an inverse volatility weighting methodology, assigning higher weights to stocks with lower volatility. No single stock exceeds 2% weight, with the top 10 holdings comprising approximately 12.05% of the portfolio.
- Lower Expense Ratio
With an expense ratio of 0.25%, this ETF is cost-effective compared to similar funds, helping investors reduce investment costs.
Fund Name (Ticker) | Invesco S&P 500® Low Volatility ETF (SPLV US) |
Description |
|
Asset Class | Equity |
30-Day Average Volume (as of 4 Mar) | 1,467,406 |
Net Assets of Fund (as 4 Mar) | $7,624,300,000 |
12-Month Yield (as of 4 Mar) | 1.72% |
P/E Ratio (as of 4 Mar) | 24.76x |
P/B Ratio (as of 4 Mar) | 3.74x |
Expense Ratio (Annual) | 0.25% |
Top Holdings
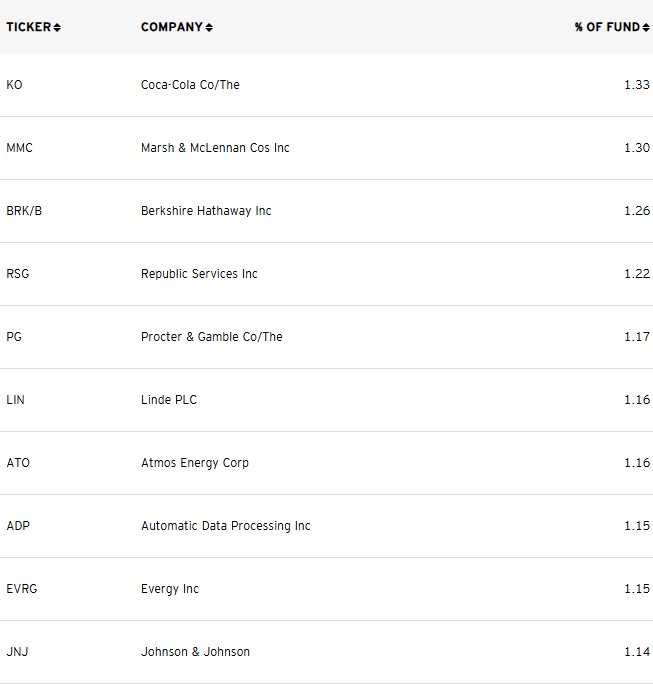
(as of 3 March 2025)

(Source: Bloomberg)

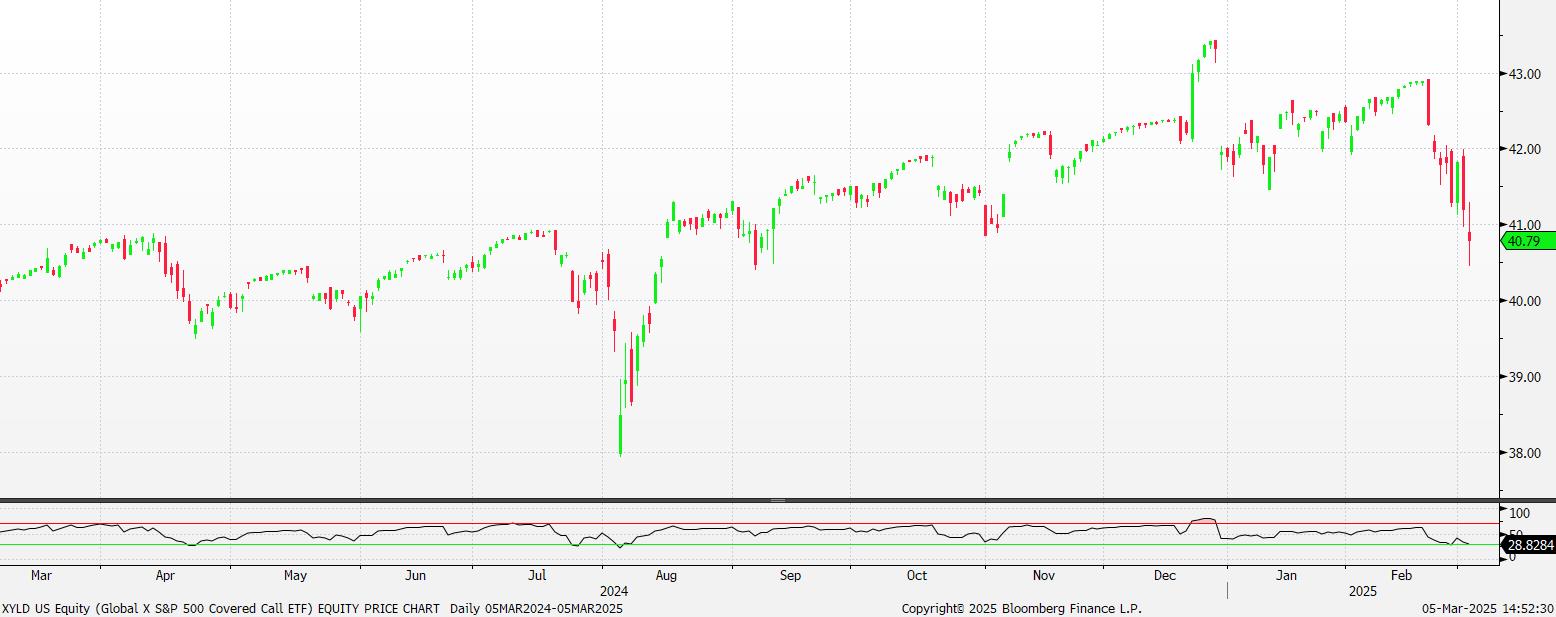
Global X S&P 500 Covered Call ETF (XYLD US)
- Covered Call Strategy
This ETF follows a covered call strategy by holding stocks while selling call options on the underlying securities, generating additional income through option premiums.
- Monthly Dividend Payouts
While the S&P 500 index has historically yielded around 1.8% annually over the past decade, this ETF enhances income through both dividends and option premiums, making it suitable for income-focused investors with a monthly distribution mechanism.
- Reducing Portfolio Volatility
With S&P 500 valuations remaining elevated by historical standards, this ETF is an option for investors looking to reduce volatility in their U.S. large-cap equity exposure.
Fund Name (Ticker) |
|
Description |
|
Asset Class | Equity |
30-Day Average Volume (as of 4 Mar) | 660,976 |
Net Assets of Fund (as of 3 Mar) | $3.25B |
12-Month Yield (as of 3 Mar) | 12.16% |
P/E Ratio (as of 3 Mar) | 21.39x |
P/B Ratio (as of 3 Mar) | 4.15x |
Expense Ratio (Annual) | 0.60% |
Top 10 Holdings
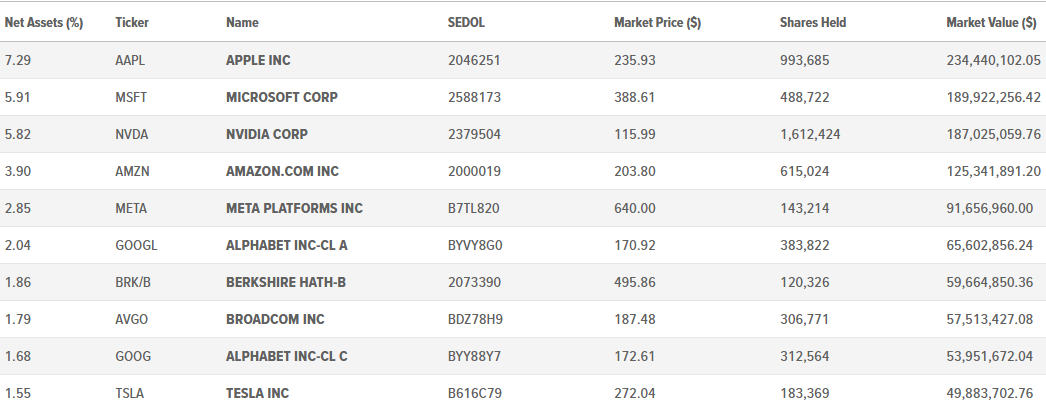
(as of 4 March 2025)

(Source: Bloomberg)