27 February 2025: Investment Product Ideas

Tech Software Stocks Poised for Upside Potential
- The U.S. tech sector may see rotation, with software stocks showing strong momentum. ETFs offer a way to capture this trend.
- Software stocks also provide investors with a degree of resilience amid ongoing trade tensions, particularly as the United States continues to navigate disputes with key global partners. Unlike hardware companies, which are more exposed to tariffs and supply chain disruptions, software firms operate with fewer dependencies on physical goods and international manufacturing. This relative immunity to trade restrictions makes software stocks a more attractive option for investors seeking stability in an uncertain geopolitical landscape. Additionally, as businesses increasingly prioritize digital transformation, demand for software solutions remains strong regardless of trade-related headwinds.
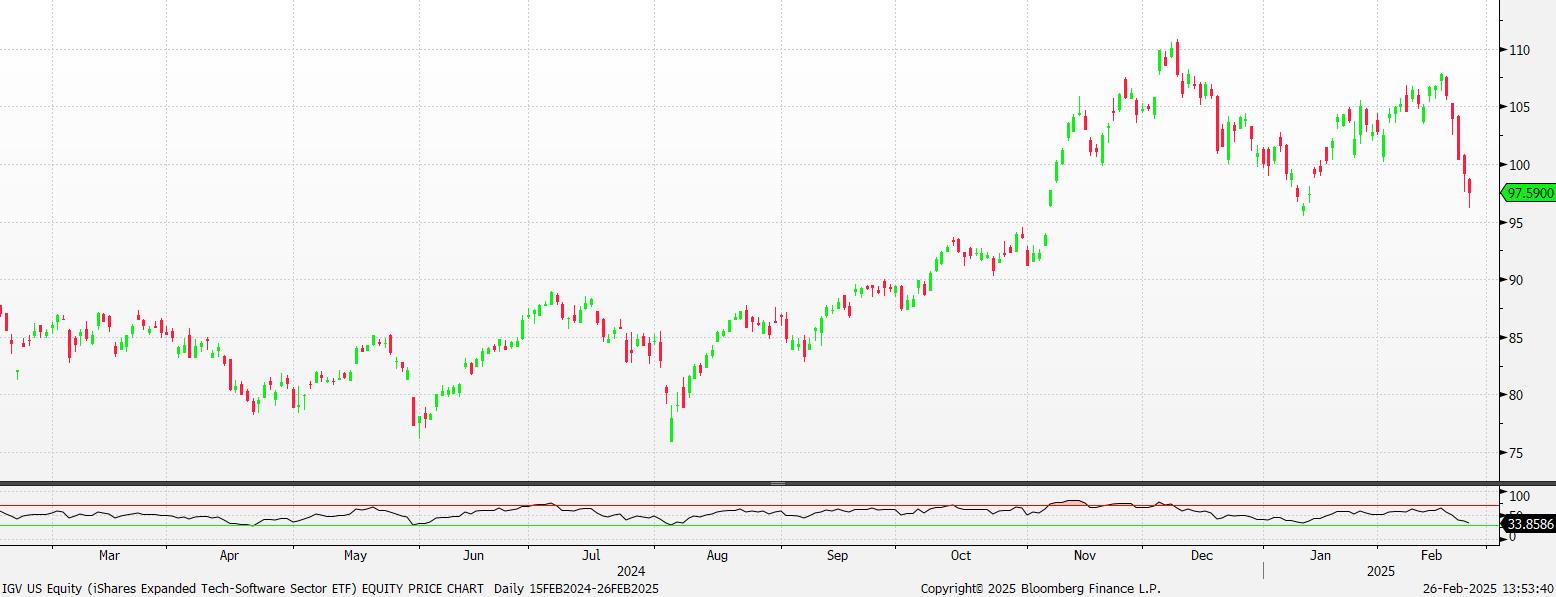
iShares Expanded Tech-Software Sector ETF (IGV US)
- Focused on the Technology Software Sector
The ETF tracks an index invested in North American software companies within the technology and communications services sectors, including interactive home entertainment and media. Ideal for investors seeking sector-specific exposure.
- Concentrated Holdings
The ETF primarily holds large-cap stocks, including Oracle, Microsoft, Salesforce, Palantir Technologies, and ServiceNow. With around 120 holdings, the top ten holdings account for approximately 60.04% of the portfolio.
- Large Asset SizeFounded nearly 24 years ago, the ETF has an asset size of approximately $11.61 billion. Compared to similar ETFs, it boasts a larger asset base and strong liquidity.
Fund Name (Ticker) |
|
Description | The iShares Expanded Tech-Software Sector ETF seeks to track the investment results of an index composed of North American equities in the software industry and select North American equities from interactive home entertainment and interactive media and services industries. |
Asset Class | Equity |
30-Day Average Volume (as of 24 Feb) | 6,931,186 |
Net Assets of Fund (as 25 Feb) | $10,508,145,717 |
12-Month Yield (as of 31 Jan) | 0.00% |
P/E Ratio (as of 24 Feb) | 56.98x |
P/B Ratio (as of 24 Feb) | 10.01x |
Expense Ratio (Annual) | 0.41% |
Top Holdings
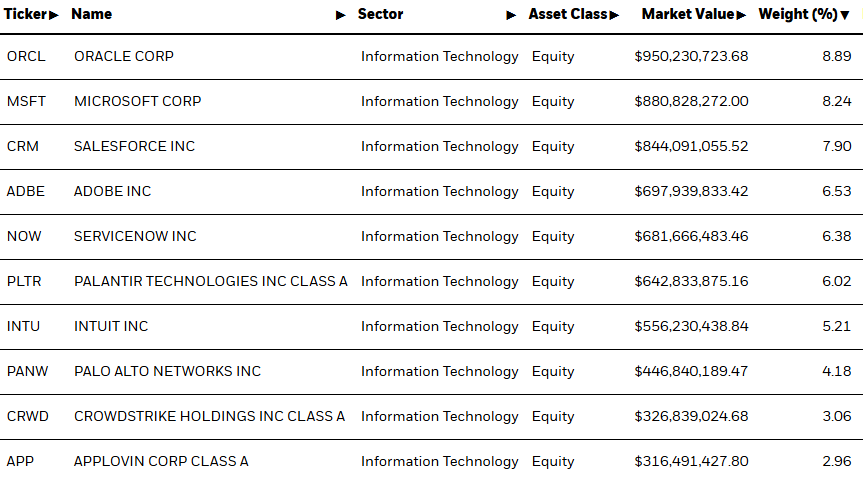
(as of 24 February 2025)

(Source: Bloomberg)

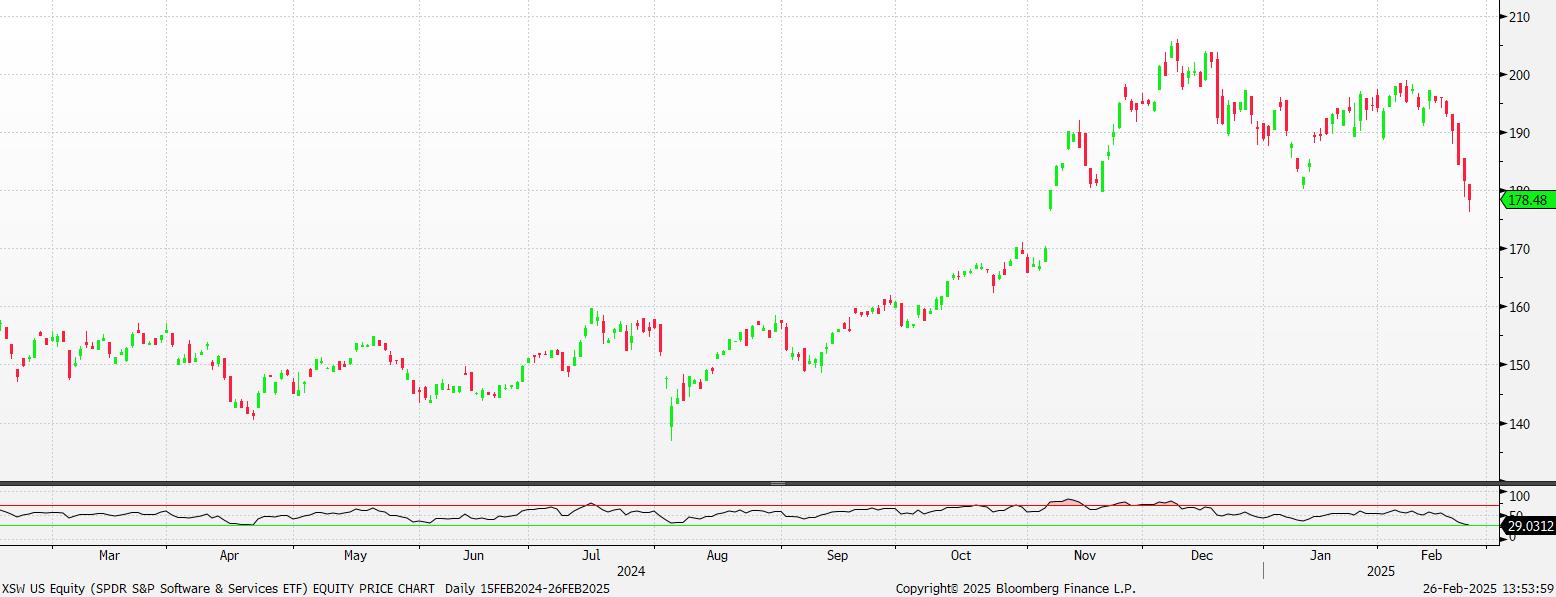
SPDR S&P Software & Services ETF (XSW US)
- Expanding Coverage in the Software and Services Sector
The ETF tracks an index that invests in application software, interactive home entertainment, IT consulting services, and system software providers. It is suitable for investors looking to target specific sectors.
- Relatively Diversified Holdings
Compared to its peers, this ETF has relatively diversified holdings, covering large, mid, and small cap software and tech companies such as D Wave Quantum Inc, Palantir Technologies, AppLovin, Samsara Inc, and Cadence Design Systems. It holds around 145 stocks, with the top 10 making up roughly 9.78%.
- Low Expense Ratio
The ETF has an expense ratio of 0.35% which is relatively low compared to similar ETFs, offering cost efficiency and helping investors reduce investment costs.
Fund Name (Ticker) | SPDR S&P Software & Services ETF (XSW US) |
Description | The SPDR S&P Software & Services ETF seeks to provide exposure to the software and services segment of the S&P TMI, which comprises the following sub-industries: Application Software, Interactive Home Entertainment, IT Consulting & Other Services, and Systems Software. |
Asset Class | Equity |
30-Day Average Volume (as of 25 Feb) | 47,004 |
Net Assets of Fund (as of 24 Feb) | $545.85M |
12-Month Yield (as of 25 Feb) | 0.0758% |
P/E Ratio (as of 24 Feb) | 26.63x |
P/B Ratio (as of 24 Feb) | 4.69x |
Expense Ratio (Annual) | 0.35% |
Top 10 Holdings
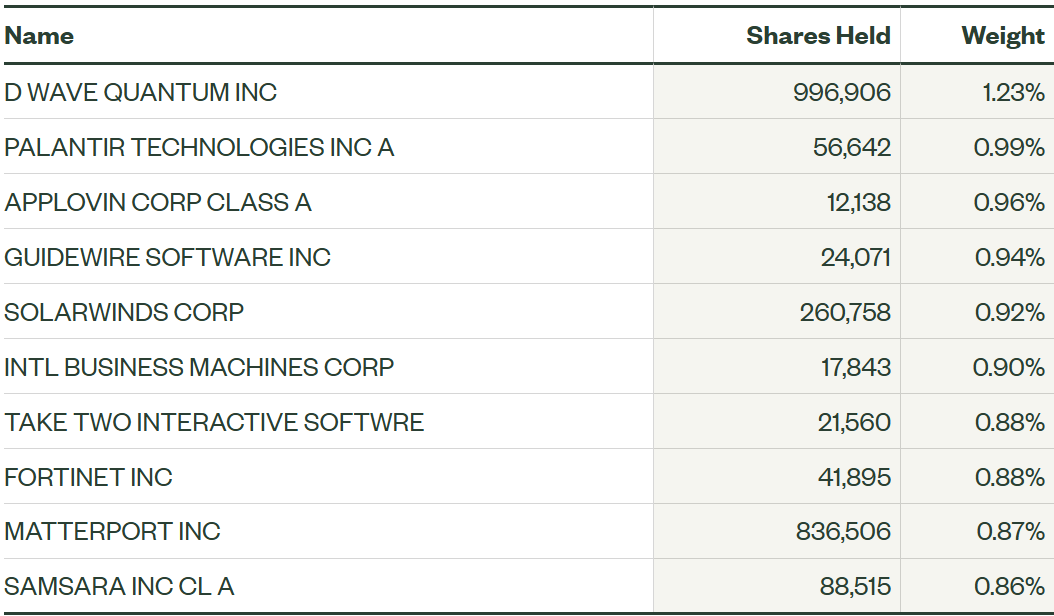
(as of 24 February 2025)

(Source: Bloomberg)