
24 April 2025: Investment Product Ideas

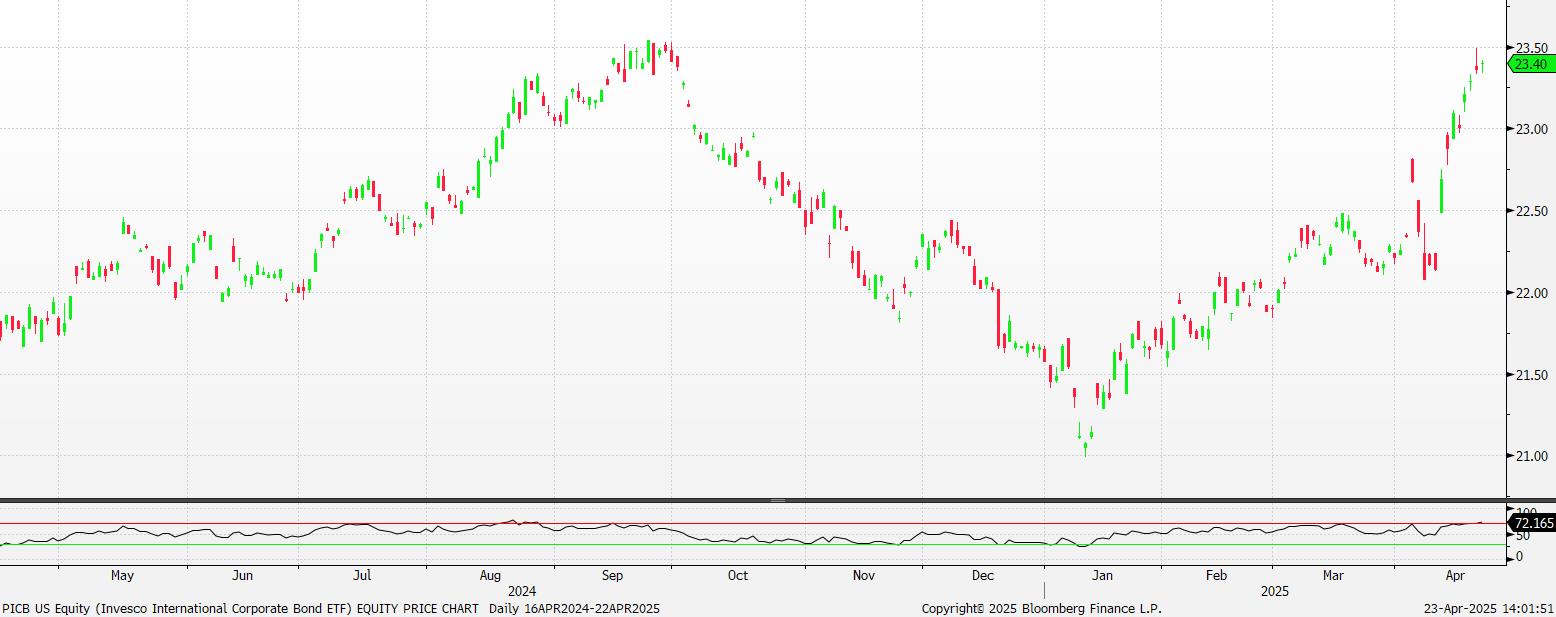
Invesco International Corporate Bond ETF (PICB US)
- Diversified Regional Exposure. The tracked index comprises investment-grade corporate bonds denominated in G10 currencies and spans multiple regions. Compared with corporate bond ETFs focused on a specific area, this diversification helps mitigate the impact of geographic concentration risk on the overall portfolio.
- Focus on Investment-Grade Bonds. At least 80% of the bonds held in the portfolio are rated BBB or higher, indicating investment-grade corporate bonds. This reflects strong credit quality and lower default risk, contributing to reduced overall credit risk within the portfolio.
- Concentration in the Financial Sector. The ETF holds over 580 corporate bonds across various industries, with the financial sector accounting for the largest allocation—over 40% of the total portfolio.
Fund Name (Ticker) | Invesco International Corporate Bond ETF (PICB US) |
Description | The Invesco International Corporate Bond ETF (Fund) is based on the S&P International Corporate Bond Index® (Index). The Fund will normally invest at least 80% of its total assets in investment-grade corporate bonds that comprise the Index. The Index measures the performance of investment-grade corporate bonds issued in the following currencies of Group of Ten (G10) countries, excluding the US dollar (USD): Australian dollar (AUD), British pound (GBP), Canadian dollar (CAD), euro (EUR), Japanese yen (JPY), Swiss franc (SFR), New Zealand dollar (NZD), Norwegian krone (NOK) and Swedish krona (SEK). The Index is computed using the net return, which withholds applicable taxes for non-resident investors. The Fund and the Index are rebalanced monthly and reconstituted annually in September. |
Asset Class | Fixed Income |
30-Day Average Volume (as of 22 Apr) | 40,164 |
Net Assets of Fund (as of 22 Apr) | $137.7M |
12-Month Yield (as of 22 Apr) | 2.98% |
Yield to Maturity (as of 17 Apr) | 3.95% |
Effective Duration (as of 17 Apr) | 5.66 yrs |
Expense Ratio (Annual) | 0.50% |
Top Holdings
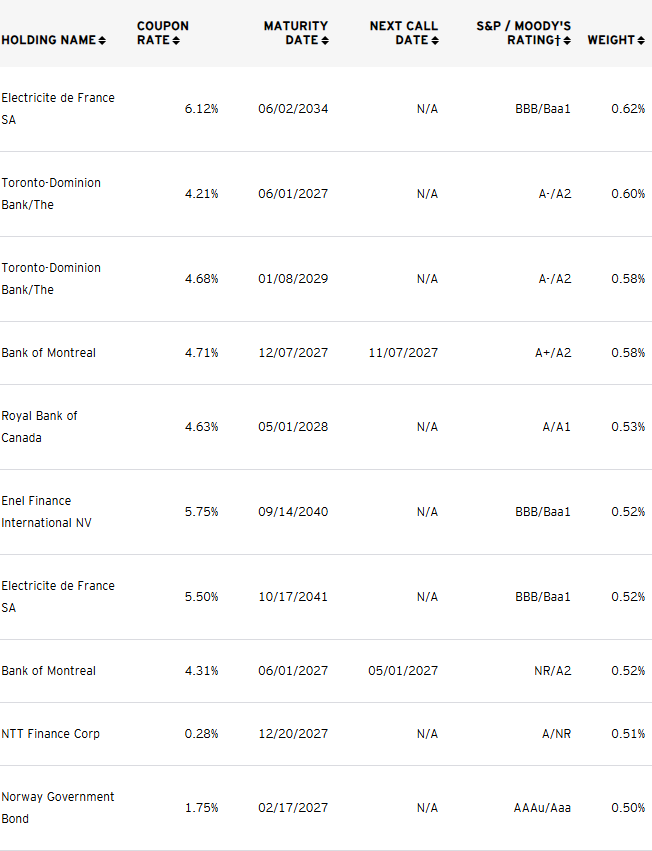
(as of 21 April 2025)

(Source: Bloomberg)

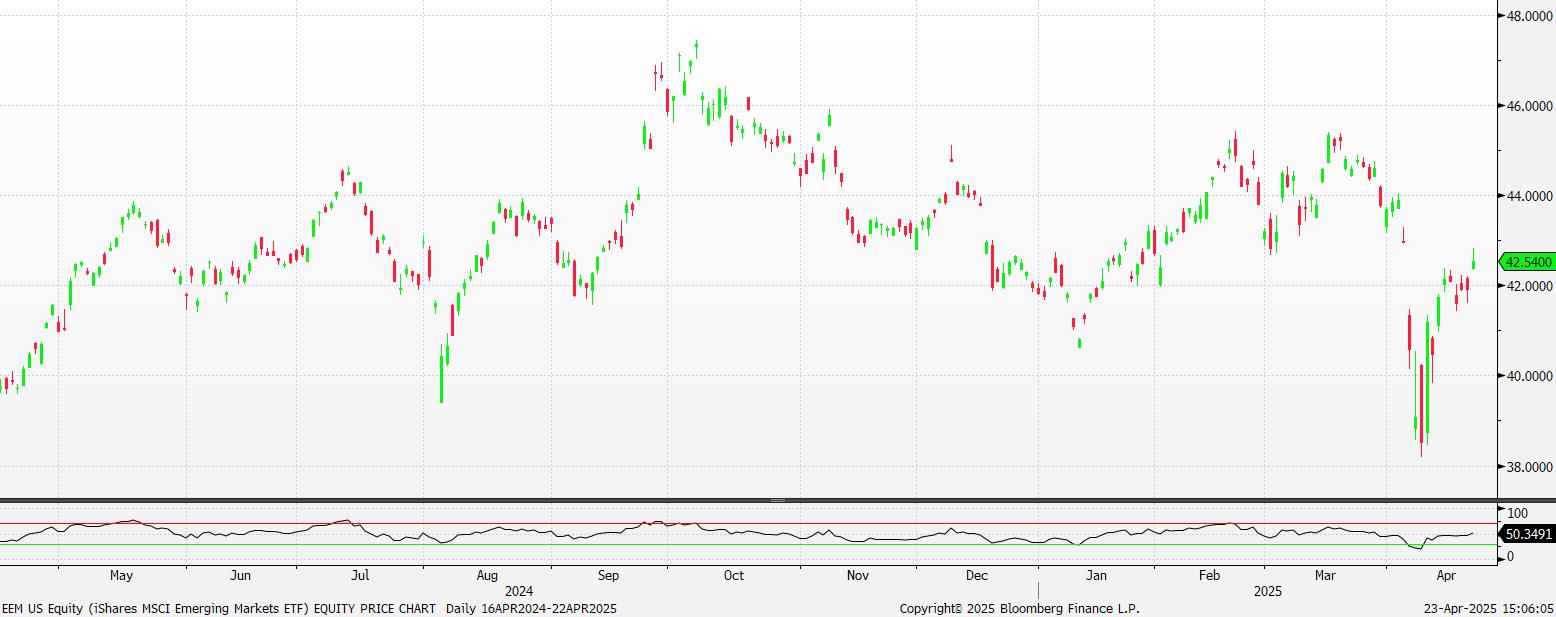
iShares MSCI Emerging Markets ETF (EEM US)
- Diversification Away from Potential US Dollar Weakness. Faced with US dollar depreciation due to economic uncertainty stemming from tariffs and policy changes, investors might seek to diversify their portfolio by allocating to international assets. EEM provides a convenient way to gain exposure to a broad basket of emerging market equities. While the ETF is USD-denominated, the underlying companies’ revenues and earnings are often generated in their local currencies. Should the US dollar continue to weaken, the relative value of these emerging market companies and their earnings could become more attractive, potentially benefiting the ETF’s overall return. This offers a diversification benefit beyond just individual stocks.
- Broad Exposure to Emerging Market Growth. This index-tracking fund offers diversified exposure to a wide array of large and mid-sized companies located across various emerging market countries. It is well-suited for investors seeking to capitalize on the potentially higher economic growth rates and favorable demographics often found in developing nations, offering a stake in the expansion of these economies.
- Diversified Geographic Holdings. The portfolio provides exposure to a multitude of emerging economies, reducing the risk associated with focusing on a single country. By tracking the MSCI Emerging Markets Index, the fund includes significant allocations to key markets like China, India, and Taiwan, allowing investors to participate in the collective growth and dynamism of these diverse regions.
Fund Name (Ticker) | iShares MSCI Emerging Markets ETF (EEM US) |
Description | The iShares MSCI Emerging Markets ETF seeks to track the investment results of an index composed of large- and mid-capitalization emerging market equities. |
Asset Class | Equity |
30-Day Average Volume (as of 21 Apr) | 34,461,083 |
Net Assets of Fund (as of 22 Apr) | $16,064,455,351 |
12-Month Yield (as of 31 Mar) | 2.33% |
P/E Ratio (as of 21 Apr) | 14.20x |
P/B Ratio (as of 21 Apr) | 1.86x |
Expense Ratio (Annual) | 0.72% |
Top Holdings
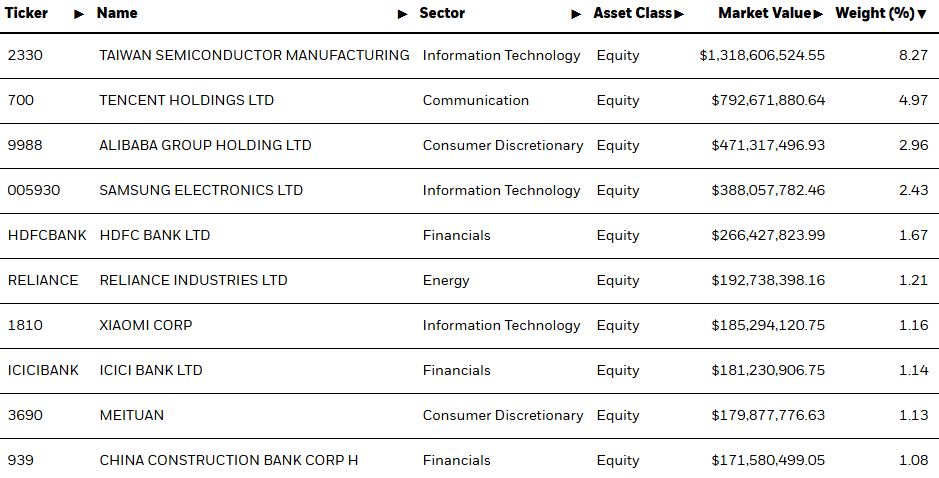
(as of 21 April 2025)

(Source: Bloomberg)