
3 October 2024: Wealth Product Ideas

Monetary and Fiscal Policies Remain Supportive
- The Federal Reserve’s monetary easing cycle is expected to be beneficial for the U.S. oil and gas sector. Rate cuts may weaken the U.S. dollar, potentially encouraging increased investment activity in emerging markets and internationally, particularly in economies that typically show an inverse relationship to the dollar.
- Regarding the upcoming U.S. election, neither political party has indicated plans to tighten fiscal policy or adopt a hostile position toward the U.S. oil and gas industry. With consensus pointing toward continued monetary easing and stimulatory fiscal policy in the near term, these trends could support energy equity valuations through 2025.
Short term crude oil & natural gas outlook
- According to the U.S. Energy Information Administration (EIA), ongoing withdrawals from global oil inventories are expected to push Brent crude oil spot prices back above US$80 per barrel. More oil is anticipated to be drawn from inventories in the fourth quarter of 2024 than previously projected, as OPEC+ has delayed production increases until December, which were initially planned for October. While concerns about economic and oil demand growth, particularly in China, have risen and contributed to lower oil prices, OPEC+ production cuts have resulted in global oil consumption outpacing production. The Brent crude oil spot price is projected to average US$82 per barrel in the fourth quarter of 2024 and US$84 per barrel in 2025.
-
Additionally, it also forecasted natural gas prices to remain relatively stable during the shoulder season in September and October, before experiencing a general rise in 2025. This increase is expected as U.S. natural gas production may not keep up with the growing demand from U.S. liquefied natural gas (LNG) exports. The Henry Hub spot price is projected to rise from below US$2.00 per million British thermal units (MMBtu) in August to approximately US$3.10/MMBtu in 2025.
Brent Crude Oil Prices

(Source: Bloomberg)
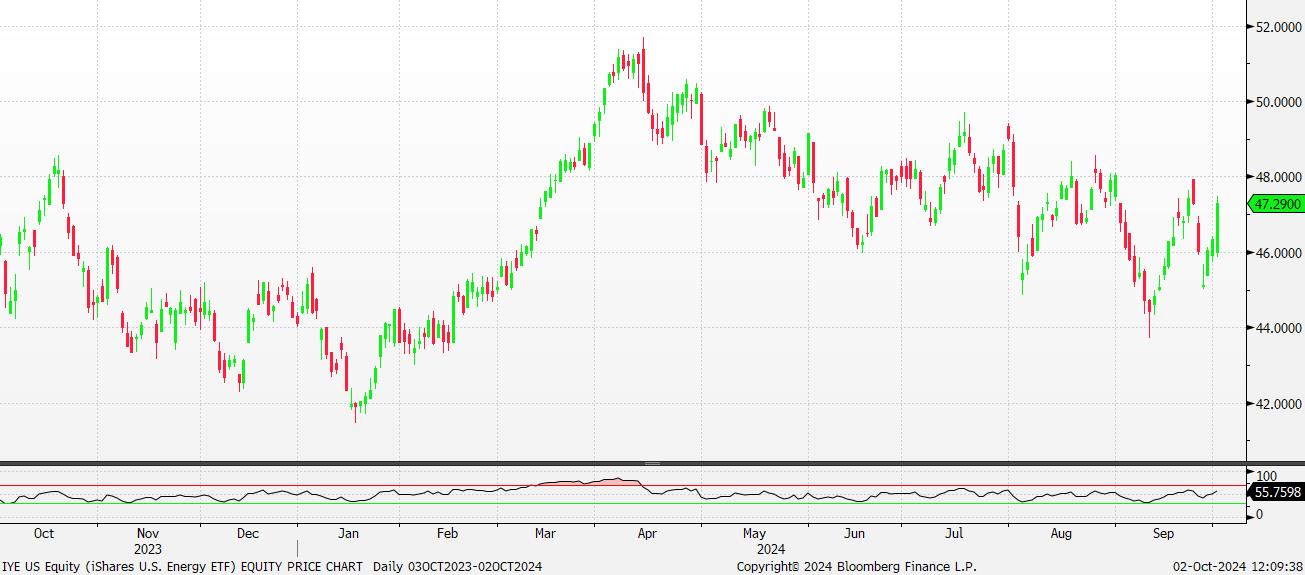
Fund Name (Ticker) | iShares U.S. Energy ETF (IYE US) |
Description | The iShares U.S. Energy ETF seeks to track the investment results of an index composed of U.S. equities in the energy sector. |
Asset Class | Equity |
30-Day Average Volume (as of 30 Sep) | 288,525 |
Net Assets of Fund (as of 1 Oct) | $1,262,124,681 |
12-Month Yield (as of 31 Aug) | 2.68% |
P/E Ratio (as of 30 Sep) | 11.12 |
P/B Ratio (as of 30 Sep) | 2.18 |
Expense Ratio (Annual) | 0.39% |
Top 10 Holdings
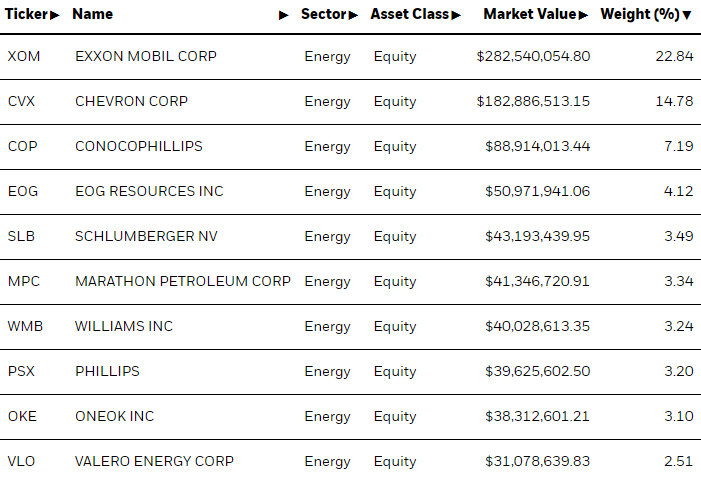
(as of 30 September 2024)

(Source: Bloomberg)

Seeking Refuge from Market Volatility in the Midstream
- Despite near-term weakness in energy prices, midstream equities have outperformed the broader equity market in 2024, delivering more consistent returns than their upstream and downstream counterparts.
- Midstream MLPs and corporations continue to benefit from rising energy production and constrained pipelines. Absent a prolonged downturn in global consumption, they may enhance the defensive posture of a portfolio’s energy allocation.
- Monetary policy and fiscal policy likely to remain supportive for U.S. oil & gas
- MLPX invests in midstream infrastructure entities such as pipelines and storage facilities that have less sensitivity to energy prices and may offer above-average yields.
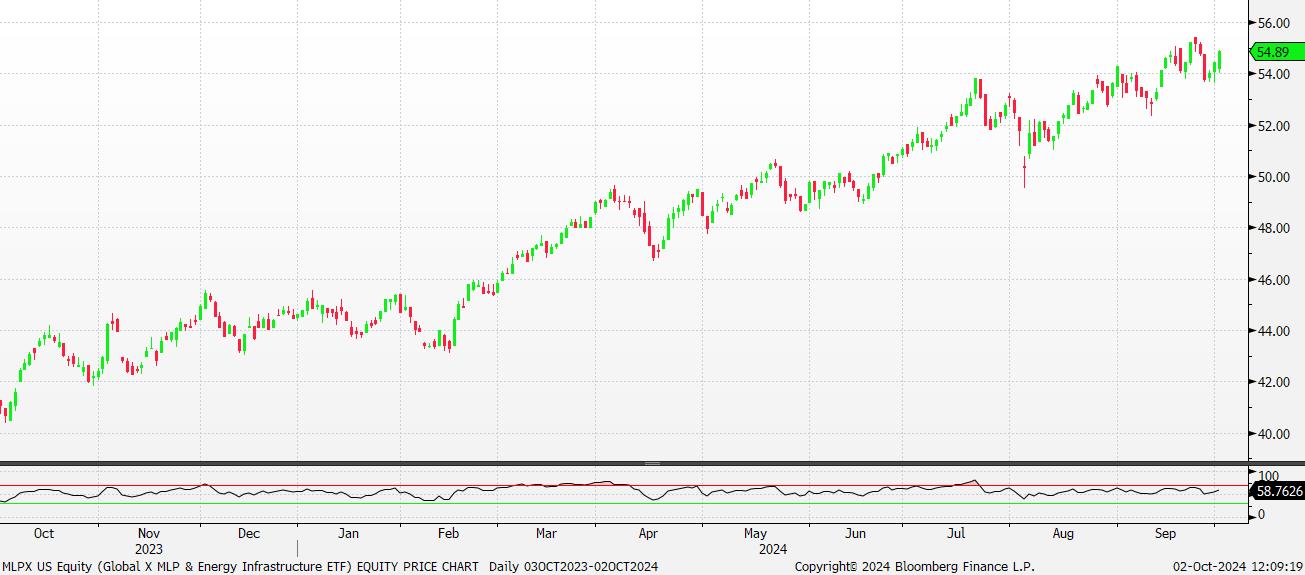
Fund Name (Ticker) | MLP & Energy Infrastructure ETF (MLPX US) |
Description | The Global X MLP & Energy Infrastructure ETF (MLPX) seeks to provide investment results that correspond generally to the price and yield performance, before fees and expenses, of the Solactive MLP & Energy Infrastructure Index. |
Asset Class | Equity |
30-Day Average Volume (as of 01 Oct) | 186,089 |
Net Assets of Fund (as of 01 Oct) | $1,912,230,704 |
12-Month Yield (as of 01 Oct) | 3.46% |
P/E Ratio (as of 30 Sep) | 16.89 |
P/B Ratio (as of 30 Sep) | 2.93 |
Expense Ratio (Annual) | 0.45% |
Top 10 Holdings
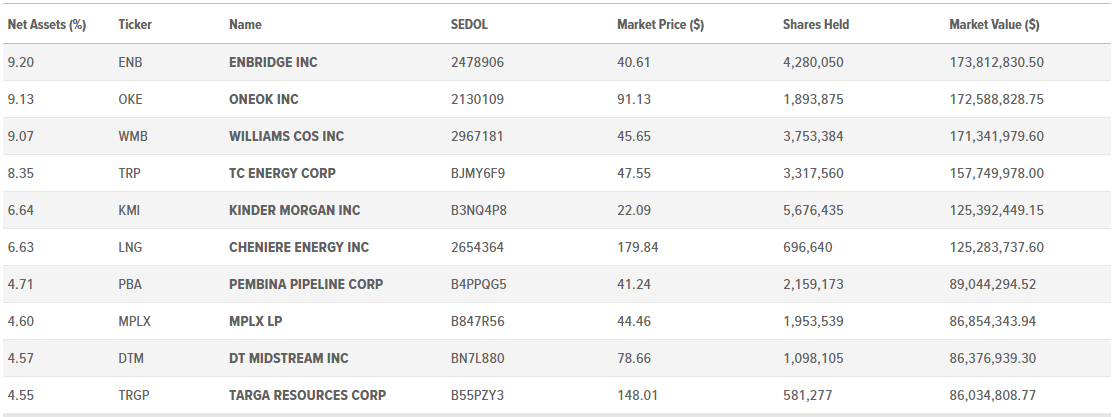
(as of 30 September 2024)

(Source: Bloomberg)