14 November 2024: Wealth Product Ideas

First HK-listed ETF tracks the US Magnificent Seven
- Taking advantage of the difference in Hong Kong and US stock trading hours to respond to overnight news in advance
- Investing in the US-listed US Tech ETF requires a 30% dividend tax, which is waived when investing HK-listed MAG Seven ETF
Why the MAG Seven?
- MAG Seven Outperforming the Market Significantly
- Rivaling Nation’s Stock Markets in Size
- The Primary Source of US Stock Market’s Earnings Growth
- The Solid Support for their Excellent Stock Price Performance
- MAG Seven Members Take Turns to Lead the Market
Market Outlook
- Still far from a bubble
- MAG Seven to continue to ride the AI Boom
- Long-term institutional investors only slightly overweight MAG Seven
- 70% of the mainstream long-term institutional investors have held the major MAG Seven stocks, through which they hold the pricing power of the MAG Seven stocks.
- Global long-only funds with the U.S. exposure are slightly overweight Microsoft, META, Amazon, and Google, neutral about Nvidia, and underweight Apple and Tesla, without hints of significant overweight in total.
MAG Seven valuations have not yet reached bubbles levels
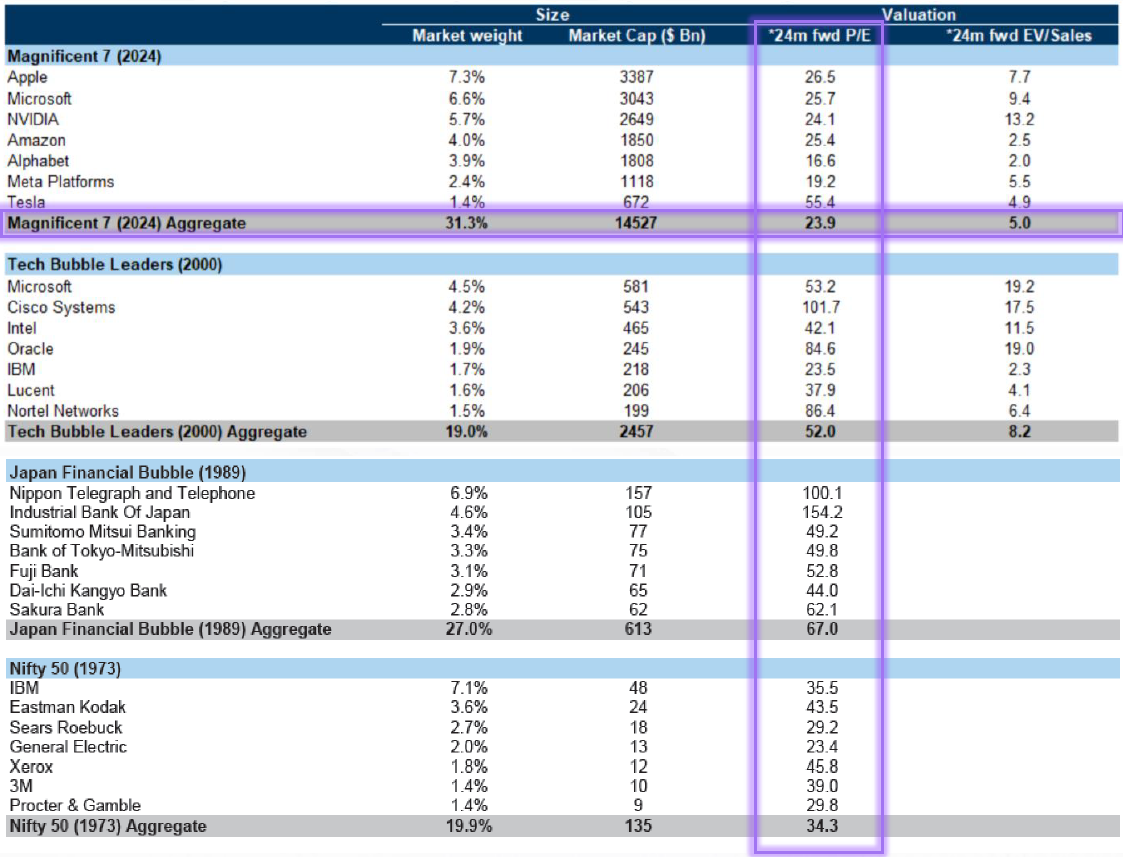
(Source: Datastream, Factset, Goldman Sachs)
|
Fund Name (Ticker) |
CSOP MAG Seven ETF (3454 HK) |
|
Description |
The investment objective of CSOP MAG Seven ETF is to provide investment results that, before fees and expenses, closely correspond to the performance of the Solactive Magnificent Seven Index (the “Underlying Index”). |
|
Asset Class |
Equity |
|
30-Day Average Volume |
N.A. |
|
Net Assets of Fund (as of 4 Nov) |
$5,393,700 |
|
12-Month Yield (as of 5 Nov) |
N.A. |
|
P/E Ratio (as of 12 Nov) |
39.105 |
|
P/B Ratio (as of 12 Nov) |
12.46 |
|
Expense Ratio (Annual) |
0.6% |
Top Holdings

(as of 6 November 2024)
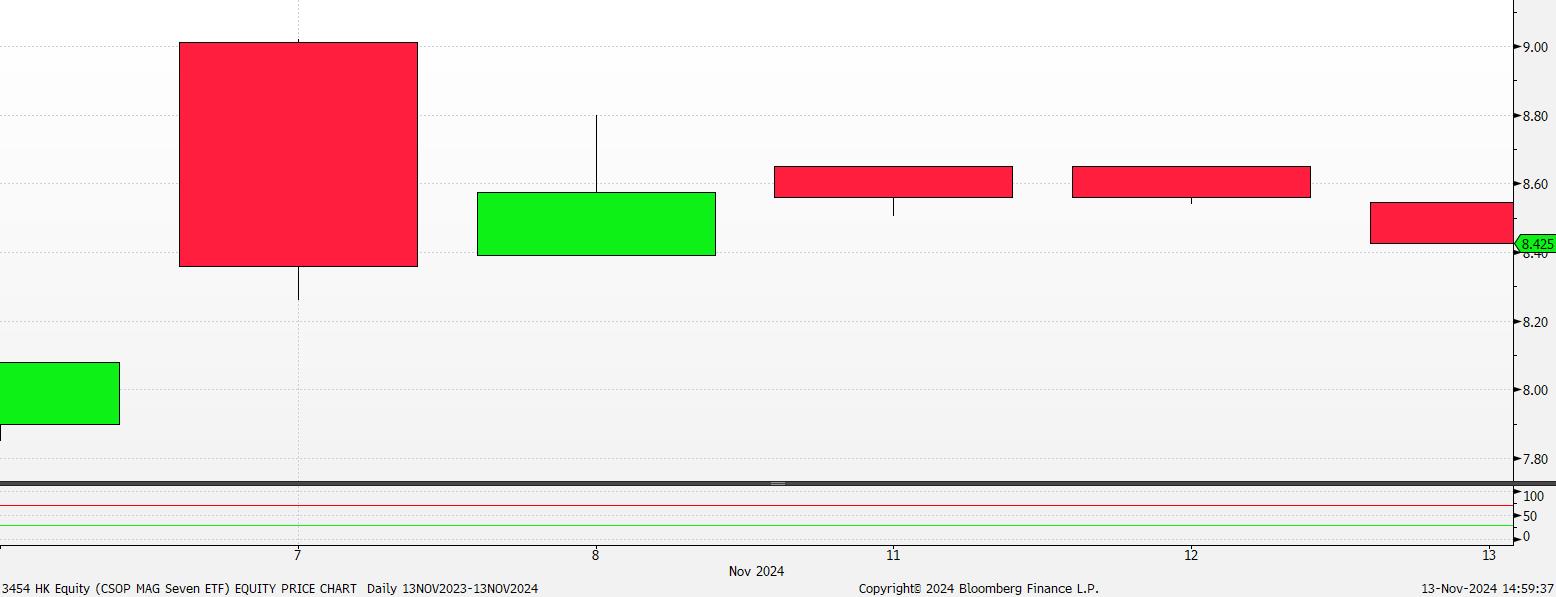
(Source: Bloomberg)

The current market landscape is characterized by significant volatility, primarily driven by:
- US Presidential Election: Political uncertainty can impact global markets.
- Geopolitical Tensions: Ongoing geopolitical conflicts can lead to market instability.
- Economic Uncertainty: Economic fluctuations, such as interest rate changes and inflation, can affect investor sentiment.
In response to these challenges, investors are increasingly seeking to diversify their portfolios. Quality factors have gained prominence, as investors prioritize companies with strong fundamentals and sustainable growth.
Free cash flow is a crucial metric that reflects a company’s financial health. It represents the cash remaining after all expenses have been paid and is a key driver of:
- Dividend payments
- Debt reduction
- Business reinvestment
VictoryShares’ Advantage
VictoryShares leverages a rigorous investment process to identify high-quality companies. Our approach combines:
- Historical and expected cash flow analysis: They assess a company’s past performance and future potential.
- Integrated growth screening: They eliminate companies with weak growth prospects.
By focusing on these factors, VictoryShares aims to deliver strong long-term performance for investors.
|
Fund Name (Ticker) |
VictoryShares Free Cash Flow ETF (VFLO US) |
|
Description |
The VictoryShares Free Cash Flow ETF seeks to offer exposure to high-quality, large-cap U.S. stocks that trade at a discount and have favorable growth prospects. VFLO seeks to provide investment results that track the performance of the Victory U.S. Large Cap Free Cash Flow Index (the Index) before fees and expenses. |
|
Asset Class |
Equity |
|
30-Day Average Volume (as of 12 Nov) |
338,997 |
|
Net Assets of Fund (as of 11 Nov) |
$1,286,576,413 |
|
12-Month Yield (as of 12 Nov) |
1.0664 |
|
P/E Ratio (as of 31 Oct) |
17.56 |
|
P/B Ratio (as of 31 Oct) |
3.38 |
|
Expense Ratio (Annual) |
0.39% |
Top 10 Holdings
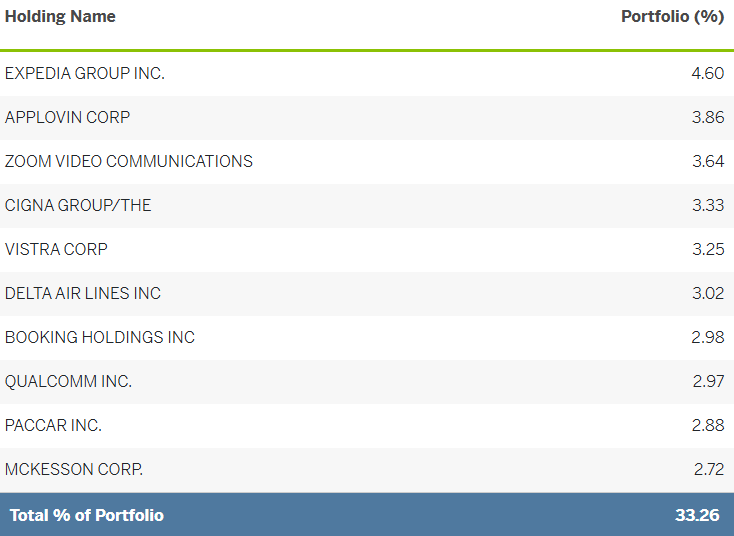
(as of 13 November 2024)

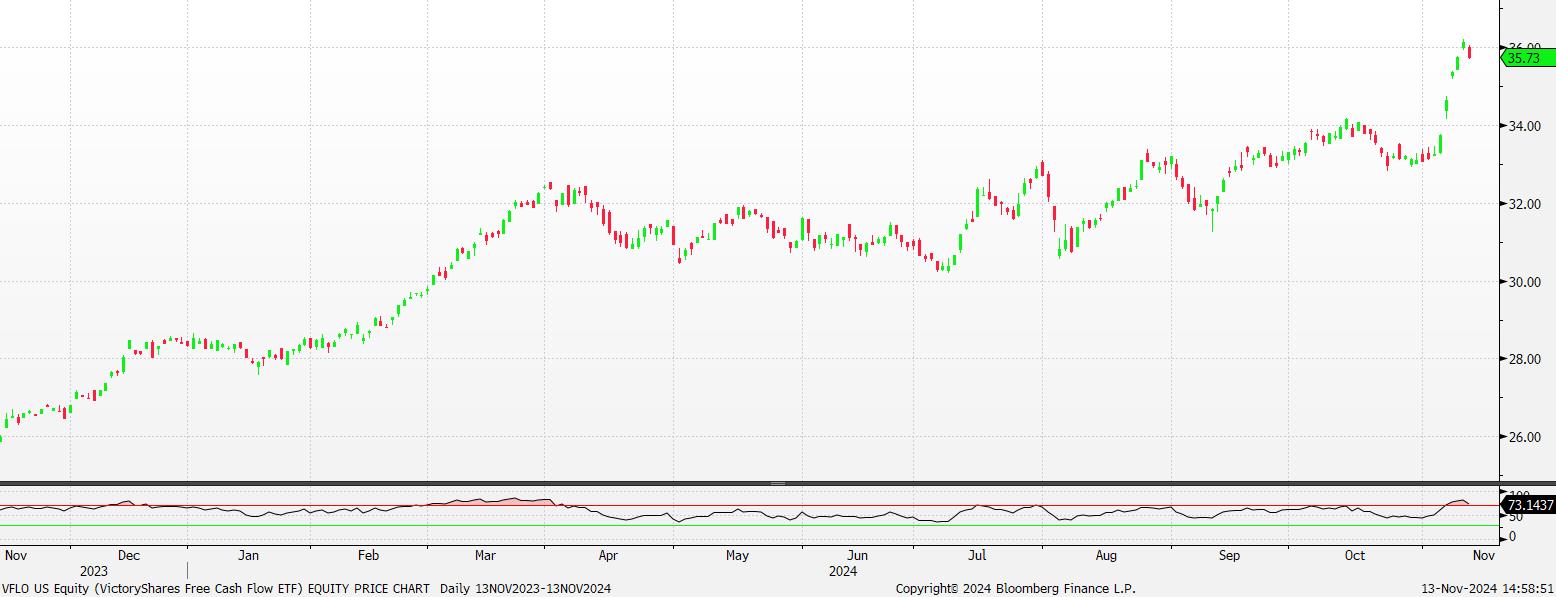
(Source: Bloomberg)


