13 September 2024: Food Empire Holdings Ltd (FEH SP), Alibaba Group Holding Ltd (9988 HK), Boston Scientific Corp (BSX US)
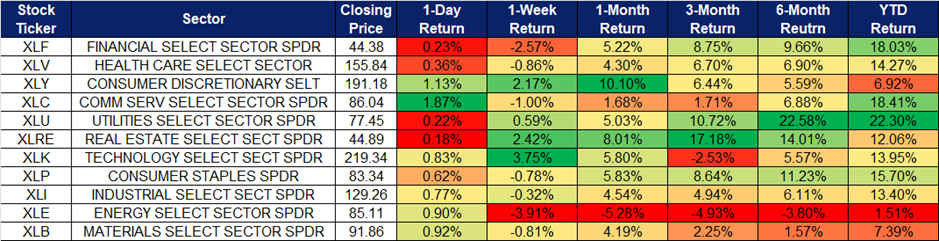
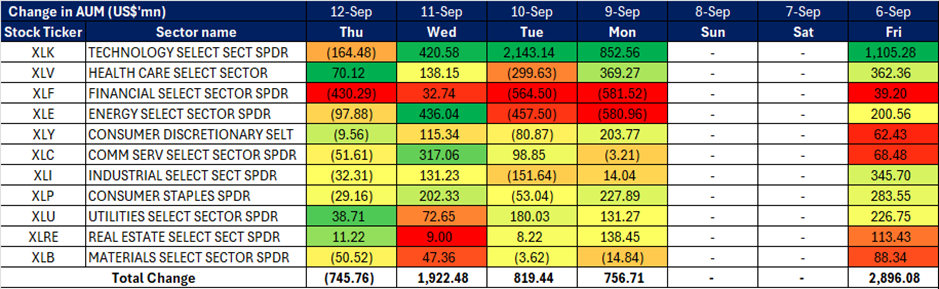
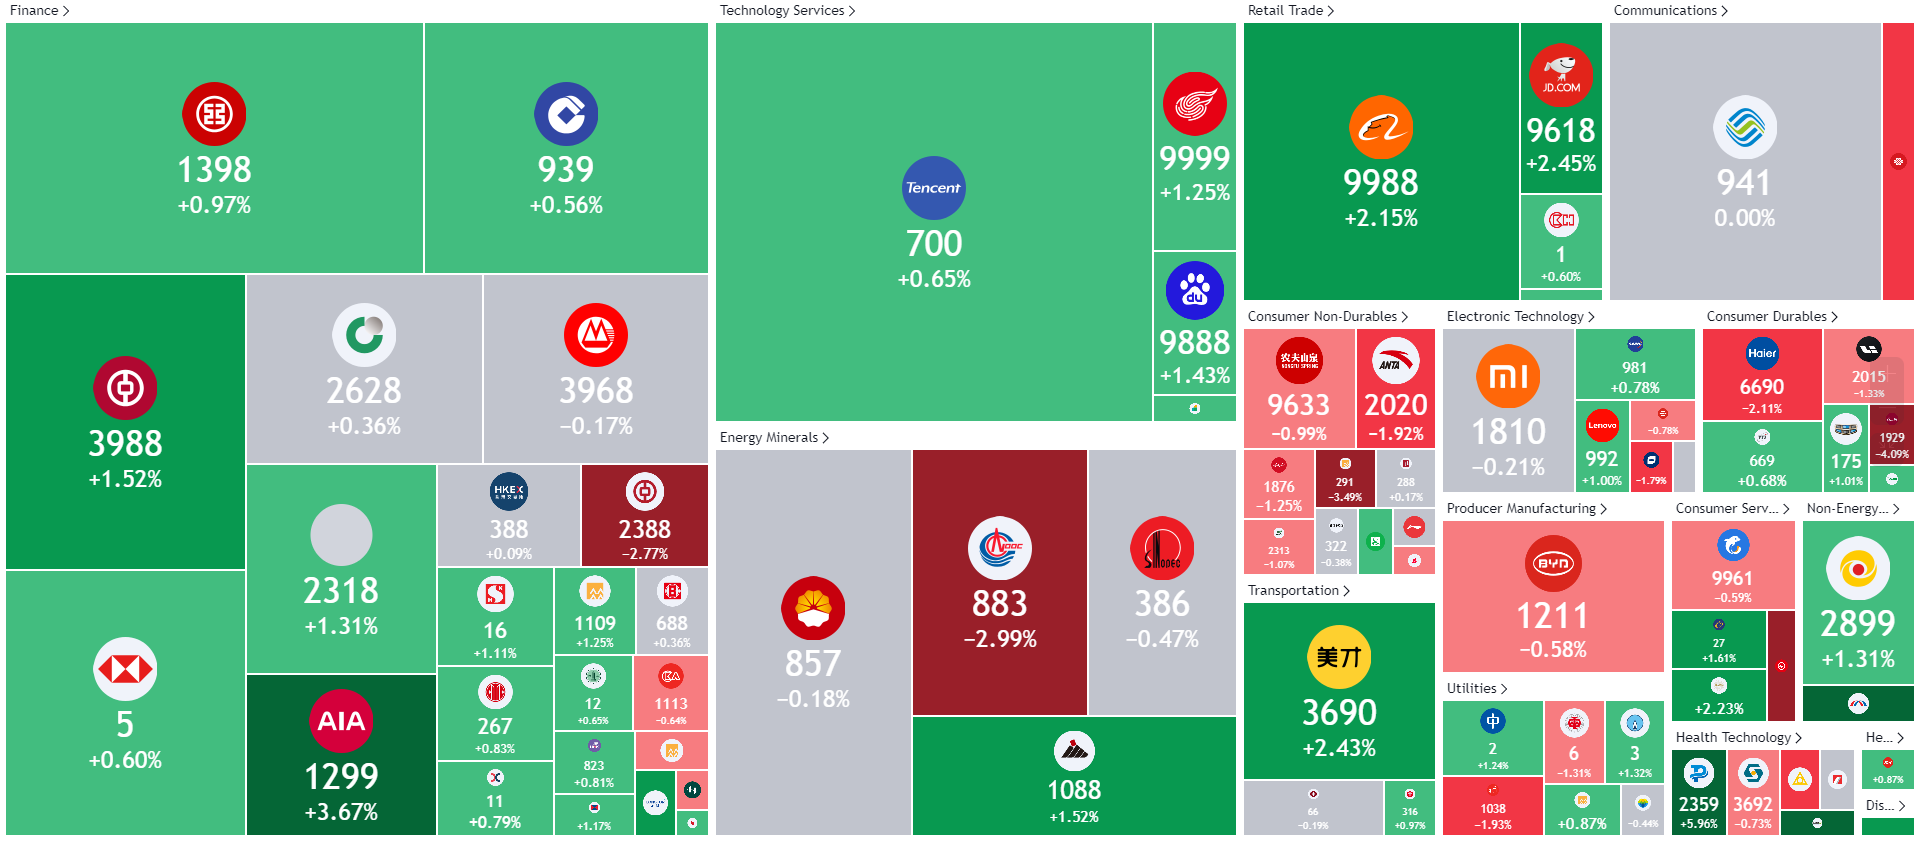
Sector Performance | Hong Kong Trading Ideas |United States Trading Ideas | Singapore Trading Ideas| Trading Dashboard

United States

Hong Kong


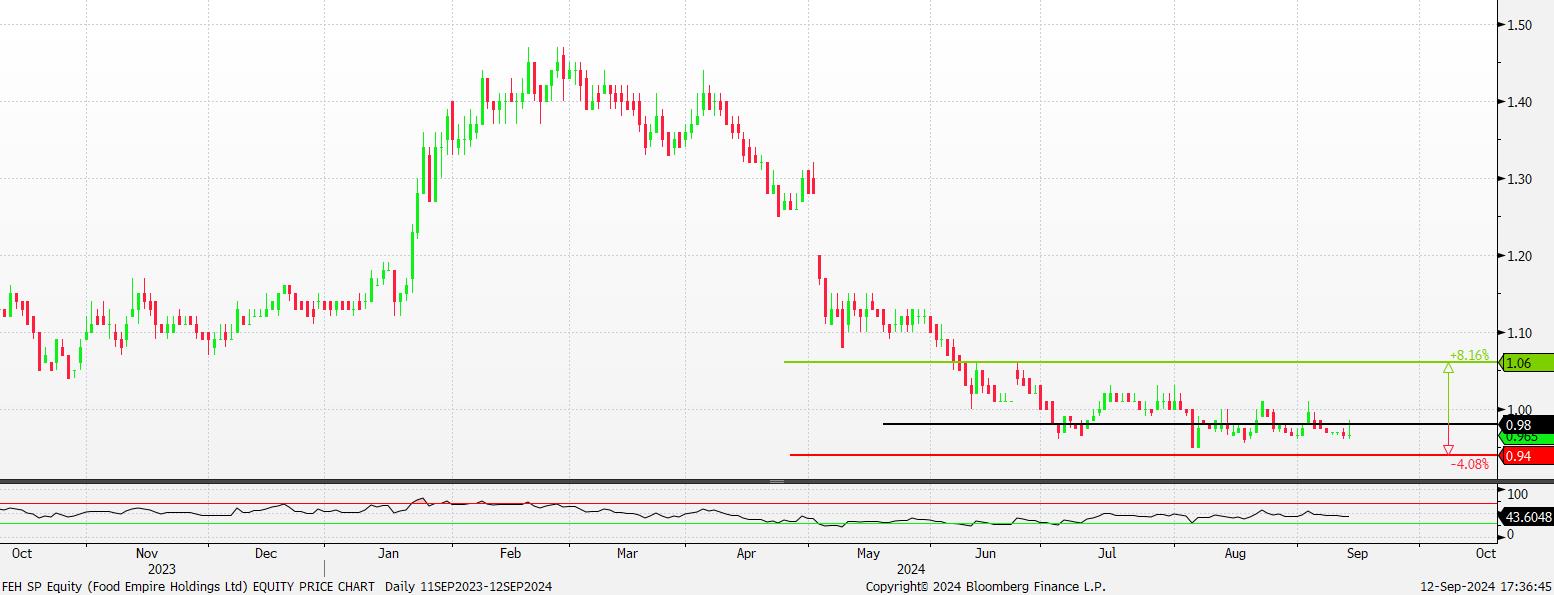
Food Empire Holdings Ltd (FEH SP): More capacity, more growth
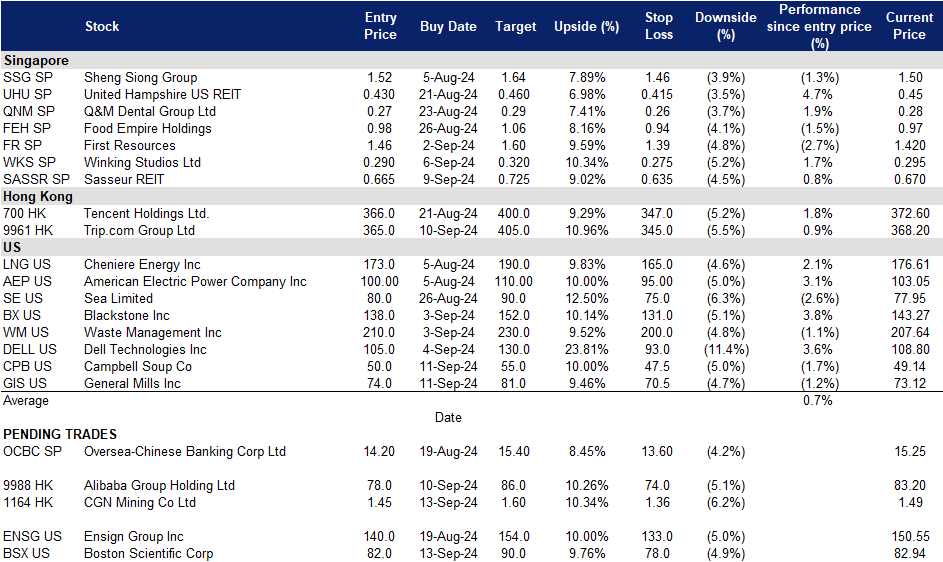
- RE-ITERATE BUY Entry – 0.98 Target– 1.06 Stop Loss – 0.94
- Food Empire Holdings Limited operates as a food and beverage manufacturing and distribution company. The Company offers beverages and snacks including classic and flavoured coffee mixes and cappuccinos, chocolate drinks, fruit-flavoured and bubble teas, cereal blends, and crispy potato snacks. Food Empire Holdings serves customers worldwide.
- Continued strong growth in South-East Asia and South Asia. Food Empire Holdings saw a sustained increase in sales across its core markets in 1H24, showcasing a resilient consumer demand for the company’s products, which saw volume growth YoY, especially in the Southeast Asia and South Asia regions. The group continues to reap the benefits of its brand-building efforts in Vietnam, increasing its market share across the Vietnamese market. Demand for the group’s products in South Asia also remains strong amidst a coffee consumption boom in the region.
- Ramped up capacity in Malaysia. The group recently completed the expansion of its non-dairy creamer production facilities in Malaysia. Commercial production started on 1st April, boosting production of non-dairy creamer going forward. The plant will reach full production capacity over the next 24 to 36 months and will drive more growth for the group’s Southeast Asia region and translate into higher revenue for the group in the region.
- 1H24 results review. Total revenue for 1H24 increased by 13.6% YoY to US$225.2mn from US$198.2mn in 1H23, led by strong growth in its South-East Asia and South Asia market, which saw a growth of 34.8% and 36.0% respectively.
- We have fundamental coverage with a BUY recommendation and a TP of S$1.35. Please read the full report here.
- Market Consensus.
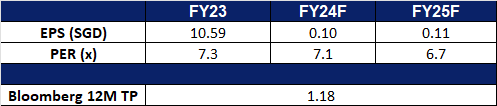
(Source: Bloomberg)

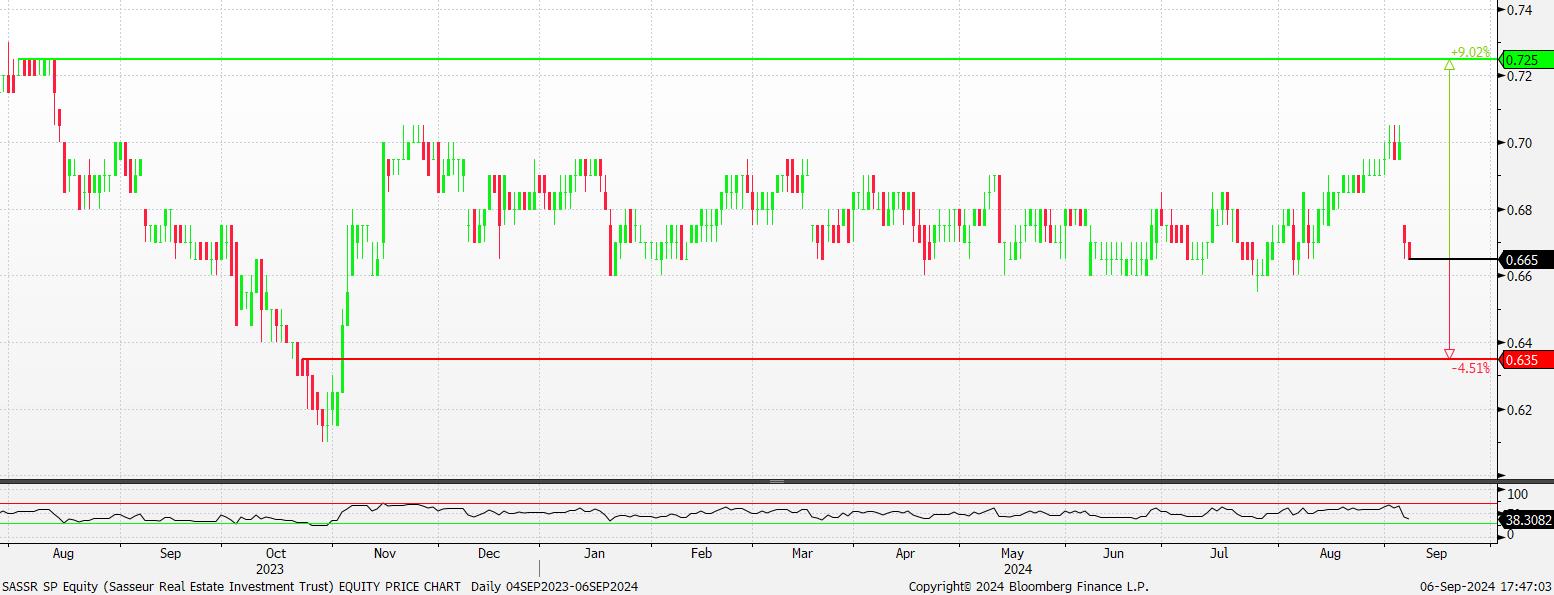
Sasseur REIT (SASSR SP): REIT-liable portfolio
- RE-ITERATE BUY Entry – 0.665 Target– 0.725 Stop Loss – 0.635
- Sasseur Real Estate Investment Trust operates as a real estate investment trust. The Company invests in a diversified portfolio of retail real estate assets. Sasseur Real Estate Investment Trust serves customers in Asia.
- Stable 1H24 performance. Sasseur REIT reported a 5.1% YoY decline in distributable income per unit (DPU) to 3.153 Scts in 1H24. Despite this, EMA rental income remained stable, delivering RMB329.0mn, a 0.9% YoY growth, equivalent to S$62.3mn, a slight 0.4% YoY decline. This performance aligns with expectations, considering the changes in the treatment of upfront borrowing costs and 20% of the REIT Manager’s base fee to be paid in cash. The 3.9% YoY decline in outlet sales in RMB during 1H24 reflects the higher sales base from 1H23, driven by pent-up demand following China’s economic reopening.
- Shifting consumer dynamics in China. Amid growing consumer caution, outlet sales have seen a modest decline. Sasseur REIT has felt the impact of weaker consumer spending in China, with sales declining YoY, exacerbated by the strong 1H23 base. The slower-than-expected recovery in the Chinese economy has added to consumption uncertainty. However, proactive management efforts, including ongoing tenant mix enhancements, are helping to attract diverse audiences and support portfolio sales performance.
- 1H24 results review. EMA rental income for 1H24 increased by 0.9% YoY to RMB329.0mn from RMB326.0mn. However, unfavourable forex movements led to a slight 0.4% YoY decline in EMA rental income, totalling S$62.3mn. The combination of forex headwinds and declining outlet sales resulted in a 2.9% YoY drop in distributable income to S$42.7mn, with a corresponding decrease in 1H24 DPU to 3.153 Scts. RMB sales for 1H24 declined by 3.9% YoY, reflecting ongoing weakness in the outlet business.
- We have fundamental coverage with a BUY recommendation and a TP of S$0.90. Please read the full report here.
- Market Consensus.
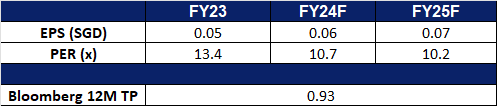
(Source: Bloomberg)


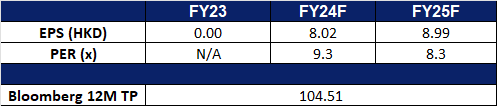
Alibaba Group Holding Ltd (9988 HK): Turning around
- RE-ITERATE BUY Entry – 78 Target 86 Stop Loss – 74
- Alibaba Group Holding Ltd provides technology infrastructure and marketing platforms. The Company operates through seven segments. China Commerce segment includes China retail commerce businesses such as Taobao, Tmall and Freshippo, among others, and wholesale business. International Commerce segment includes international retail and wholesale commerce businesses such as Lazada and AliExpress. Local Consumer Services segment includes location-based businesses such as Ele.me, Amap, Fliggy and others. Cainiao segment includes domestic and international one-stop-shop logistics services and supply chain management solutions. Cloud segment provides public and hybrid cloud services like Alibaba Cloud and DingTalk for domestic and foreign enterprises. Digital Media and Entertainment segment includes Youku, Quark and Alibaba Pictures, other content and distribution platforms and online games business. Innovation Initiatives and Others segment include Damo Academy, Tmall Genie and others.
- Added to Stock Connect program. Alibaba Group and other companies will be included in China’s Stock Connect cross-border investment scheme, linking the Shanghai, Shenzhen, and Hong Kong stock exchanges, starting from 10 September. This follows Alibaba’s upgrade to a primary listing in Hong Kong on 28 August, aimed at attracting more mainland Chinese investment. The dual primary listing, approved by shareholders, does not involve issuing new shares or raising funds. This move is part of China’s broader efforts to boost Hong Kong’s role as a global financial hub, as announced by regulators in April. The addition of Alibaba to Stock Connect will allow mainland Chinese investors to directly purchase Alibaba’s Hong Kong-listed shares, which is expected to accelerate capital outflows.
- Exports surge. In August, China’s exports grew 8.7% YoY, the fastest pace in nearly 1.5 years, driven by manufacturers rushing to fulfil orders ahead of expected tariffs. However, imports increased by only 0.5%, missing forecasts, reflecting weak domestic demand. This mixed performance highlights Beijing’s ongoing challenge to balance export-led growth with domestic demand, especially in the face of global economic uncertainties and geopolitical tensions. While the export growth has boosted investor sentiment and reflects strong global demand, China’s trade is increasingly constrained by rising tensions with the US, EU, and Southeast Asia. Additionally, weak imports, particularly of commodities, suggest that domestic economic challenges persist.
- Market expansion plans. Alibaba’s Taobao and Tmall Group (TTG) has expanded its operations with the establishment of a new company, Hangzhou Taobao and Tmall Digital Technology Co. This new venture will engage in various businesses, including import, export, household product sales, and technology services. Furthermore, TTG has recently integrated AI tools to enhance its merchant services and has begun to accept payments from Tencent’s WeChat app on Taobao and Tmall platforms. This strategic partnership with WeChat, boasting over 1.3 billion users (mostly in China), could be instrumental in expanding Alibaba’s reach in less developed regions, particularly since Alipay is not as widely used there. This move comes amidst easing regulatory scrutiny on Alibaba and reflects TTG’s efforts to diversify its business lines and compete more effectively in the Chinese e-commerce market.
- 1Q25 earnings. Revenue rose by 4.0% YoY to RMB243.24bn (US$33.47bn) in 1Q25, compared to RMB234.16bn in 1Q24. Net income fell by 27.0% YoY to RMB24.02bn (US$3.31bn) in 1Q25, from RMB33.00bn in 1Q24, due to a decrease in income from operations and the increase in impairment of investments partially offset by the mark-to-market changes from equity investments. Non-GAAP diluted earnings per ADS was RMB16.44 (US$2.26), a decrease of 5% YoY from RMB17.37 in 1Q24.
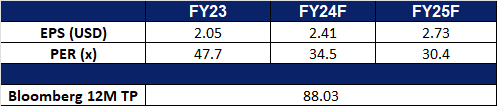
- Market consensus.
(Source: Bloomberg)

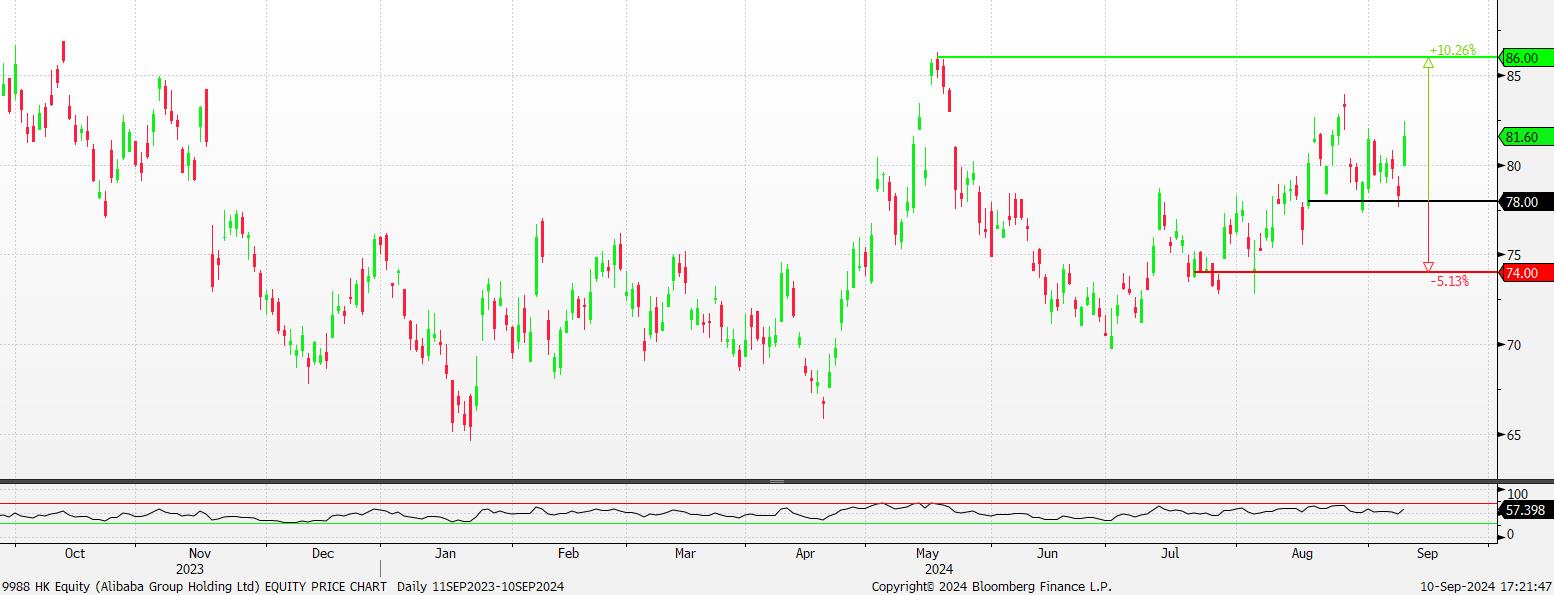
CGN Mining Co Ltd (1164 HK): Potential tight supply
- BUY Entry – 1.45 Target 1.60 Stop Loss – 1.36
- CGN Mining Co Ltd is a company mainly engaged in the trading of natural uranium. The Company operates its business through three segments. The Natural Uranium Trading segment is engaged in the trading of natural uranium. The Property Investment segment is engaged in leasing business. The Other Investments segment is engaged in investment activities.
- Potential restricted uranium supply. Russian President Putin said Moscow should consider limiting uranium, titanium, and nickel exports. Russia has approximately 44% of the world’s uranium enrichment capacity and provides 5.5% of the global supply. It owns about 8% of the global reserves. In May, the US passed the Prohibiting Russa Uranium Imports Act. Countries with nuclear energy, especially the Western ones have been sourcing reliable supplies. Russia’s potential uranium export restriction will lead to tight supplies, and prices will rebound accordingly.
- 1H24 operation update. In 1H24, the total equity source of the Group was 39,000tU and equity production was 624tU. The group was interested in 49% of the equity interest of Semizbay-U, which mainly owns and operates the Semizbay Mine and the Irkol Mine in Kazakhstan. The planned uranium extracted was 471tU with actual extraction of 477tU and the completion rate of planned production was 101% in the first half of the year; among which, actual uranium extracted from the Semizbay Mine and the Irkol Mine was 182tU and 295tU, respectively. The average production costs of the Semizbay Mine and the Irkol Mine were US$31.93/lbU3O8 and US$23.83/lbU3O8, respectively. The group was interested in 49% of the equity interest of Ortalyk, which mainly owns and operates the Central Mynkuduk Deposit and the Zhalpak Deposit in Kazakhstan. The planned uranium production was 905tU with actual production of 858tU and the completion rate of planned production was 95% in the first half of the year; among which, actual uranium extracted from the Central Mynkuduk Deposit and Zhalpak Deposit was 792tU and 66tU, respectively.
- 1H24 earnings. Revenue grew by 38.8% to HK$4.07bn. Gross loss was HK$56.4mn compared to HK$186.7mn profit in 1H23. Net profit attributable to the shareholders of the company declined by 37.0% to HK$113.1mn.
- Market consensus.

(Source: Bloomberg)


Boston Scientific Corp (BSX US): A growing stock in a defensive sector
- BUY Entry – 82 Target – 90 Stop Loss – 78
- Boston Scientific Corporation develops, manufactures, and markets minimally invasive medical devices. The Company’s products are used in interventional cardiology, cardiac rhythm management, peripheral interventions, electrophysiology, neurovascular intervention, endoscopy, urology, gynecology, and neuromodulation.
- Exhibits both defensive and growth attributes. Boston Scientific Corp demonstrated remarkable resilience during market downturns supported by strong long-term growth prospects in the healthcare sector. The aging US population and increasing medical needs are driving higher demand for healthcare services and products. The Centers for Medicare & Medicaid Services (CMS) projects national health expenditure growth of 5.6% to outpace GDP growth of 4.3%, rising from 17.3% of GDP in 2022 to 19.7% by 2032. This sustained demand highlights the healthcare sector’s enduring role in economic growth.
- Tailwinds of falling inflation and interest rate cuts. Revenue is expected to grow at an average rate of 10% for the next 3 years from FY25 to FY27, with a 14.25% growth rate expected for FY24. The slowing labour market will lead to a decline in labour costs, which will increase the Boston Scientific’s gross profit and operating profit. As a result of an interest rate cut cycle, the company’s debt costs will fall, reducing its overall interest burden and leading to an improvement in fundamentals. Additionally, as the economy and consumer confidence gradually improve, there will be an increase in demand for medical procedures that require the use of medical devices manufactured by Boston Scientific.
Gross Margin vs Net Profit Margin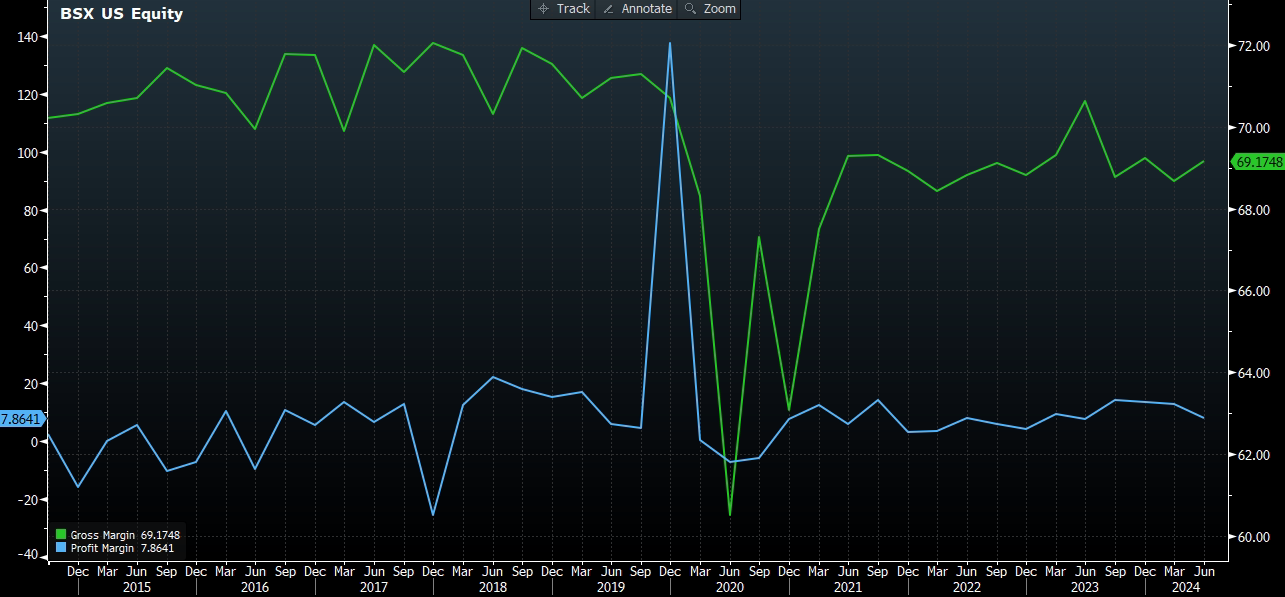
(Source: Bloomberg)
- Promising acquisitions. Boston Scientific is making strategic acquisitions to strengthen its business. It plans to acquire Axonics, a maker of devices for urinary and bowel dysfunction, for US$3.7bn, with completion now delayed to the second half of 2024. This acquisition is expected to significantly boost Boston’s urology segment, which contributes about 14% of its sales. Regulatory delays from the FTC may prolong the process. Additionally, in June, Boston Scientific also announced the acquisition of Silk Road Medical for US$1.16bn, expanding its stroke prevention portfolio with Silk Road’s TCAR technology. Both deals are set to close in 2024, with no major impact on earnings expected until 2025.
- 2Q24 earnings review. Revenue rose by 14.8% YoY to US$4.12bn, beating estimates by US$100M. Non-GAAP EPS was US$0.62, beating estimates by US$0.04. For Q3, it expects net sales growth to be between 13% to 15% vs estimated growth of 12.09% YoY and adjusted EPS to be $0.57 to $0.59 vs $0.57 consensus. For FY24, it expects net sales growth to be in the range of 13.5% to 14.5% vs estimated growth of 12.38% YoY and adjusted EPS to be $2.38 to $2.42 vs $2.33 consensus.
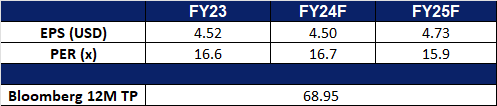
- Market consensus.
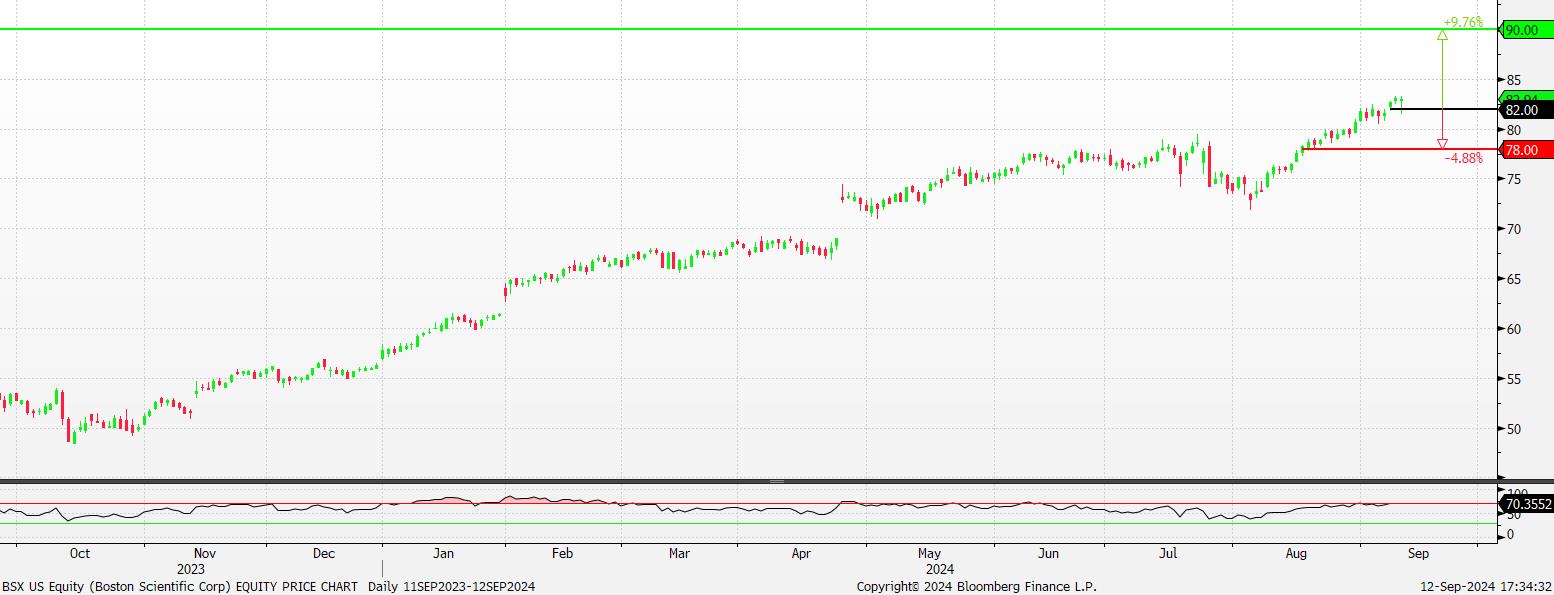
(Source: Bloomberg)
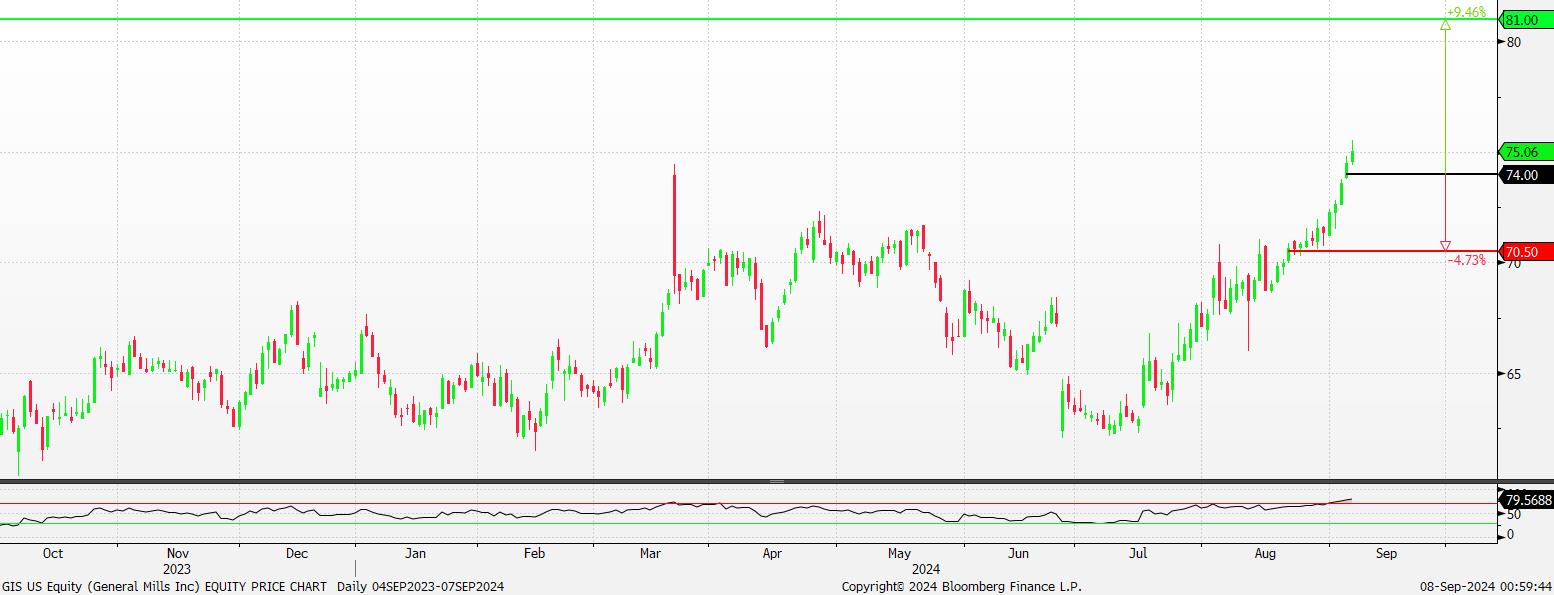
 General Mills Inc (GIS US): Risk-off in demand
- RE-ITERATE BUY Entry – 74.0 Target – 81.0 Stop Loss – 70.5
- General Mills, Inc. operates as a food company. The Company manufactures and markets branded processed consumer foods sold through retail stores. General Mills serves customers worldwide.
- Signs of slowdown in the US economy. Recent US macroeconomic data have performed poorly, and concerns about a soft landing or even recession remain. Trading recession sentiment has increased, and the discretionary consumer sector has benefited and continues to hit record highs. In addition, due to the decline in residents’ consumption power, the demand for packaged food is greater during the downturn of the economic cycle than during the upturn, which will help the company’s product sales growth.
- Tailwinds of falling inflation and interest rate cuts. Raw material prices are expected to continue to fall next year, and as the labor market begins to slow down, labor costs will decline, which will increase the company’s gross profit and operating profit. During an interest rate cut cycle, a company’s debt costs will fall. So the overall fundamentals will improve.
- 4Q24 earnings review. Revenue fell by 6.4% YoY to US$4.71bn, missing estimates by US$150M. Non-GAAP EPS was US$1.01, beating estimates by US$0.02.
- Market consensus.
(Source: Bloomberg)


Trading Dashboard Update: Add Campbell Soup Co (CPB US) at US$50 and General Mills Inc (GIS US) at US$74. Cut loss on Sunny Optical Technology Group Co Ltd (2382 HK) at HK$44.5.