
4 February 2025: Futures Product Ideas
KGI Weekly Futures Update
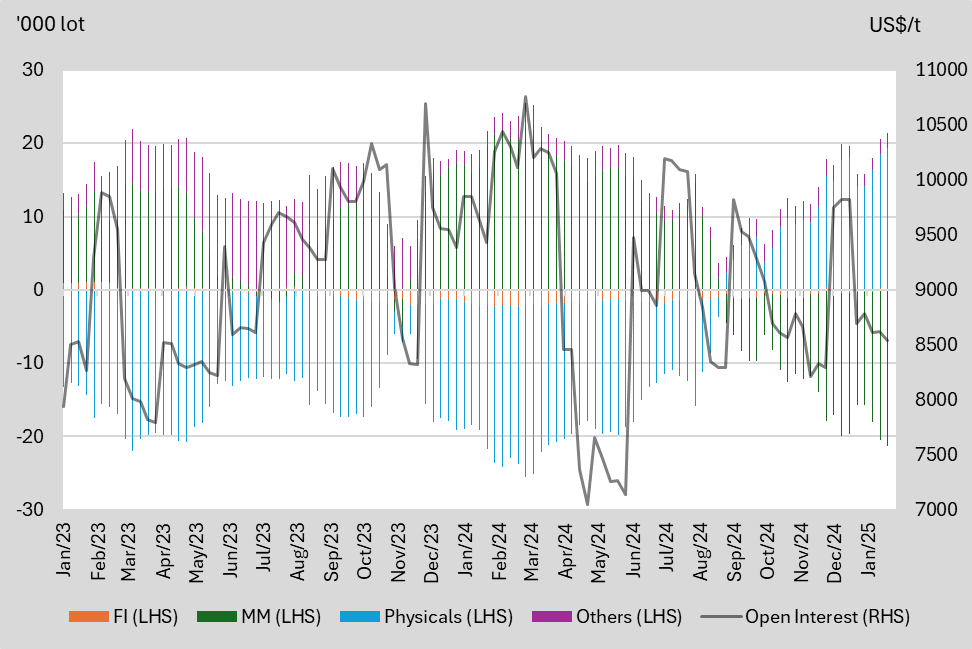
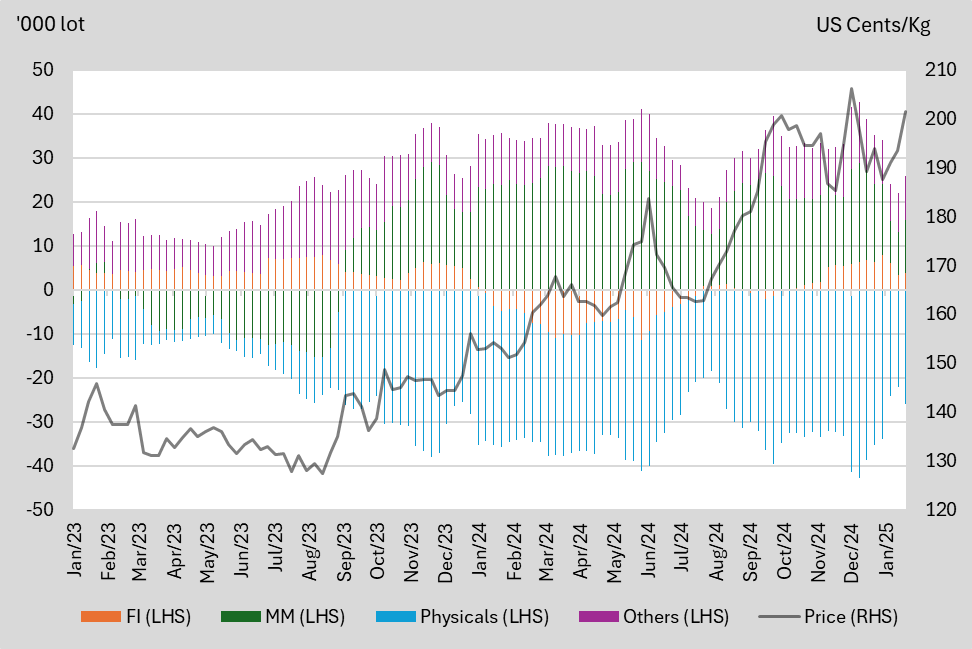
SGX TSI Iron Ore CFR China (62% Fe Fines) Index Futures
Net Long/Short and Price Comparison
We highlight the key price levels that each participants switches their positions between net long and net short based on 2024 data.
2024 | Financial Institution (FI) | Manage Money (MM) | Physicals | Others |
Net Long | Below US$118/mt | Above US$118/mt | Below US$100/mt | NA |
Net Short | Above US$118/mt | Below US$115/mt | Above US$100/mt | NA |
Net-position WoW Change | Remarks | |
FI | -7.76 | Decrease for the last two consecutive weeks |
MM | +77.35 | Largest increase in traders since 22 November 2024 |
Physicals | -64.59 | Decrease for the last two consecutive weeks |
Others | -5.00 | Decrease for the last two consecutive weeks |
Figure 1: Net-positions by participant segment and price comparison
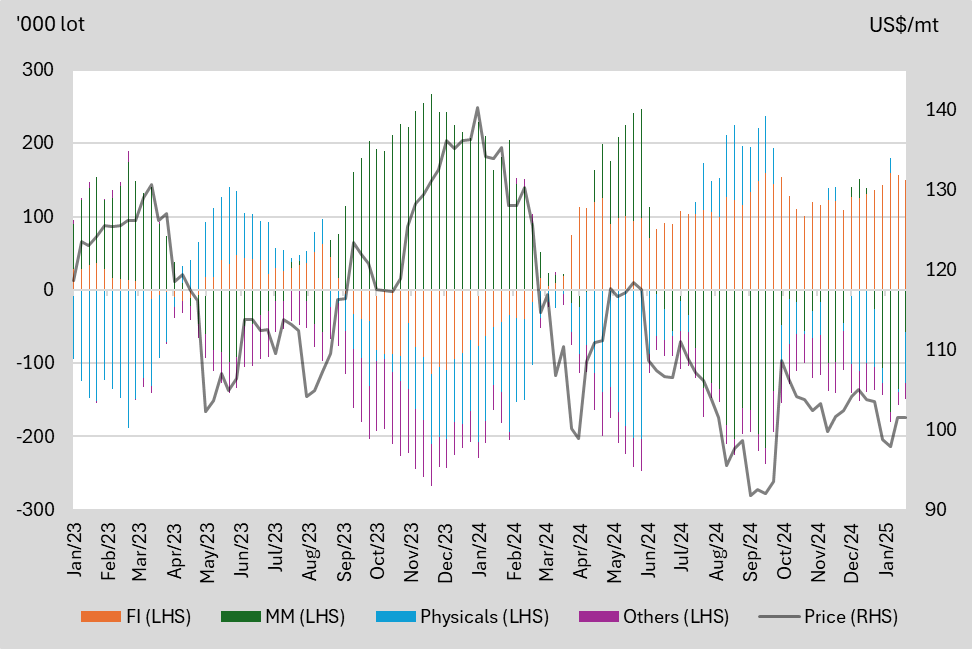
Source: SGX, KGI Research
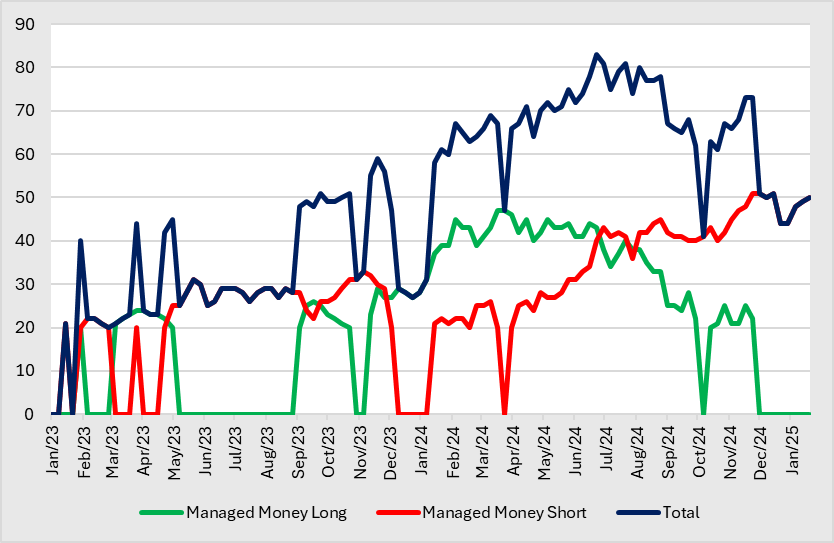
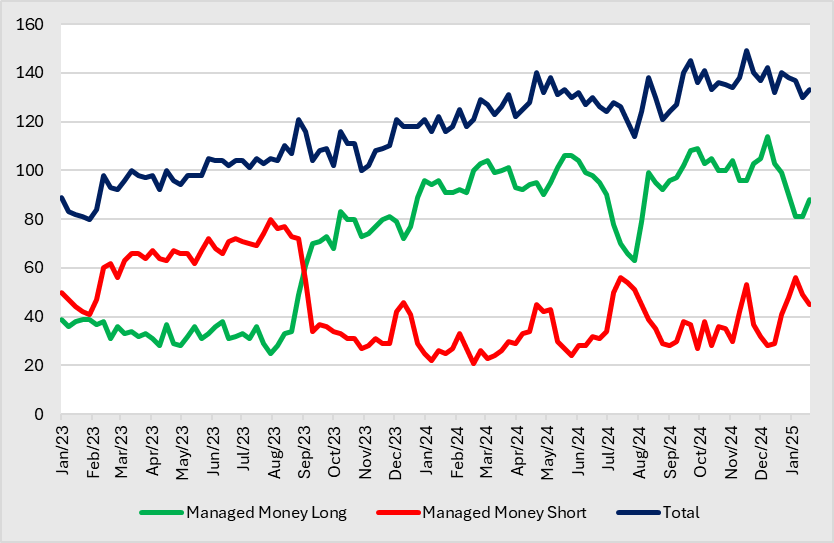
Long/Short Traders Snapshot
- Managed Money. The number of MM with long positions rebounded for three consecutive weeks to 305, since a low at the start of the year. Accordingly, the number of MM with short positions decreases further to 271, a representing a decline for 3 weeks consecutively. Seasonally, More MMs are prone to long in 1HQ4 and 2HQ2, and there are more MMs with short positions in 1HQ2 and 1HQ3.
2024 | 2023 | |||
Long | Short | Long | Short | |
High | 423 | 427 | 393 | 248 |
Low | 176 | 131 | 154 | 83 |
Figure 2: Number of position holders iron ore futures
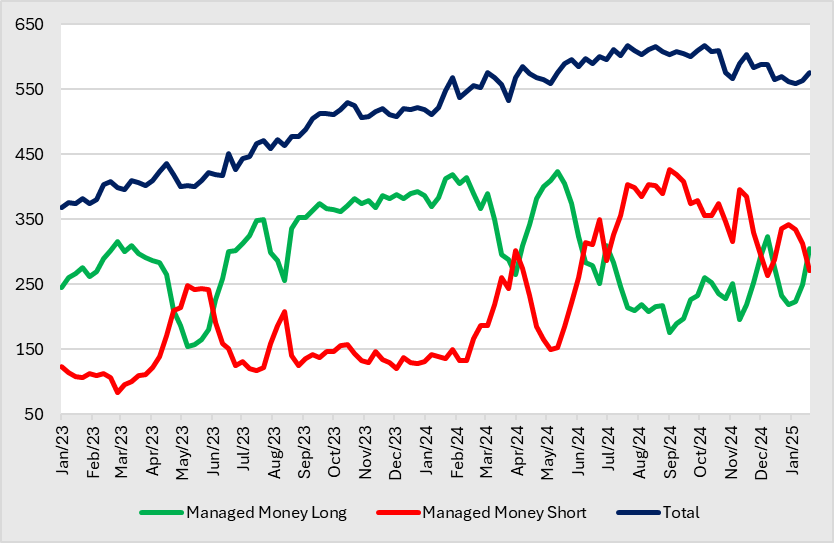
Source: SGX, KGI Research
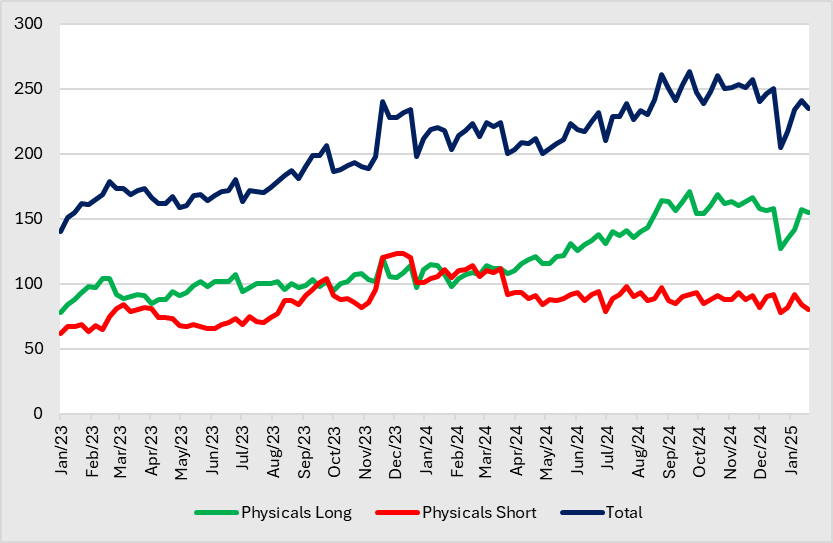
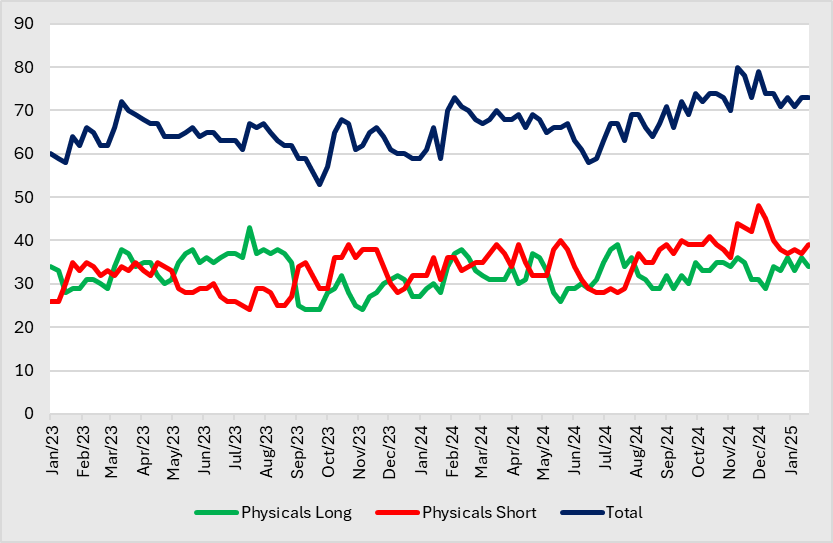
- Physicals. The number of physicals with long positions remained stable for 2 week around its current level at 124. Contrarily, the number of physical with short positions also increased for 2 consecutive weeks to 147, and represents a high since November 2023. Seasonally, More physicals are prone to long in 1Q, and there are more physicals with short positions in Q4.
2024 | 2023 | |||
Long | Short | Long | Short | |
High | 135 | 145 | 111 | 147 |
Low | 77 | 107 | 68 | 96 |
Figure 3: Number of position holders iron ore futures
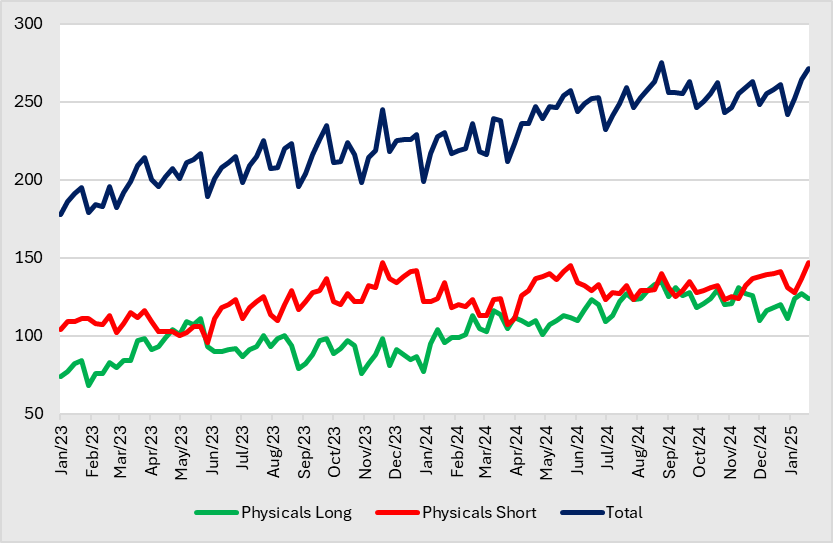
Source: SGX, KGI Research
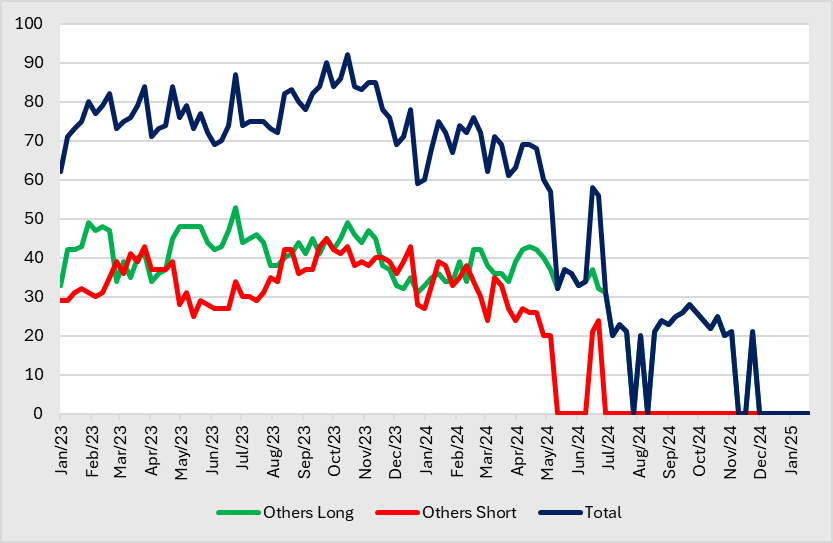
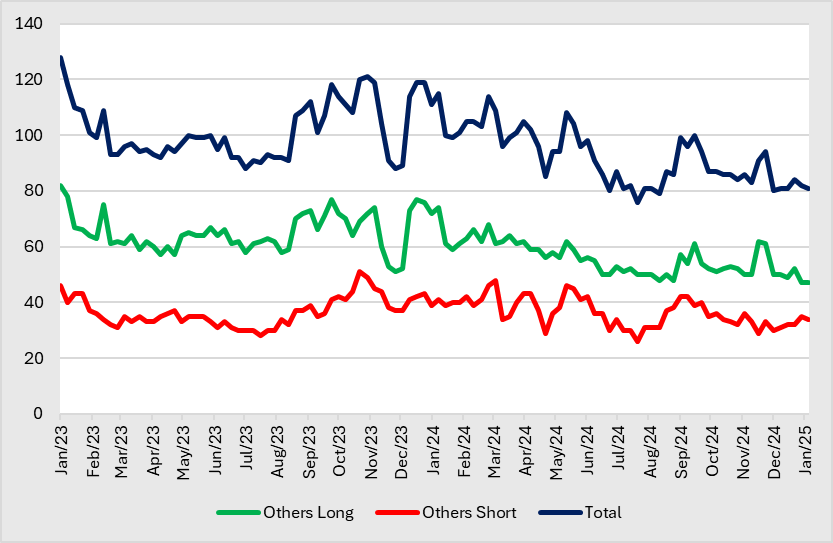
- Others. The number of others with long positions declined for 2 consecutive weeks to 90, while the number of others with short positions increased for 2 consecutive weeks to 81.
2024 | 2023 | |||
Long | Short | Long | Short | |
High | 131 | 131 | 134 | 152 |
Low | 68 | 83 | 103 | 101 |
Figure 4: Number of position holders iron ore futures
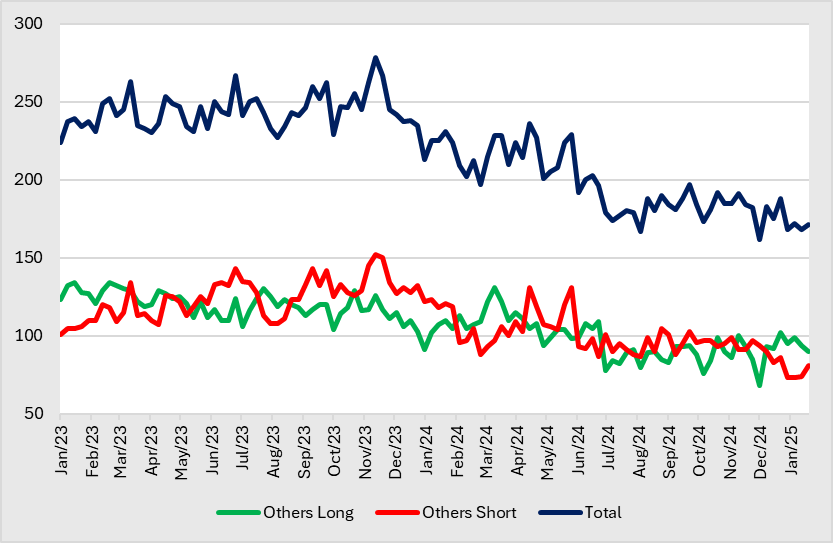
Source: SGX, KGI Research
SGX Baltic Panamax Time Charter Average Futures
We highlight the key price levels that each participants switches their positions between net long and net short based on 2024 data.
2024 | Financial Institution (FI) | Manage Money (MM) | Physicals | Others |
Net Long | NA | Above US$9,000/t | Below US$8,500/t | NA |
Net Short | NA | Below US$9,000/t | Above US$9,500/t | NA |
Net-position WoW Change | Remarks | |
FI | -0.21 | Lowest net short in 2025 |
MM | -0.79 | Highest net short since 30 August 2024 |
Physicals | +0.98 | Reached a highest net long in 2025 |
Others | +0.01 | Highest net long since mid-December |
Figure 1: Net-positions by participant segment and price comparison
Source: SGX, KGI Research
Long/Short Traders Snapshot
- Managed Money. The number of MM with long positions remained stable at 22 at the end of November. On the other hand, the number of MM with short positions recovered in 2025 to its current level at 50, representing 3 consecutive weeks of increase. Seasonally, More MM are prone to long in 1H, and there are more MM with short positions in 2H.
2024 | 2023 | |||
Long | Short | Long | Short | |
High | 47 | 51 | 29 | 33 |
Low | 20 | 20 | 20 | 20 |
Figure 2: Number of position holders freight futures
Source: SGX, KGI Research
- Physicals. The number of physicals with long positions took a dip in end December, but rebound back in 2025 to its current level at 155. Accordingly, the number of physical with short positions declined for 2 consecutive weeks to 80, representing a decline for 2 weeks. The number of physicals is on a general upward trend since 2Q, while physicals with short positions generally saw a downtrend since 2Q.
2024 | 2023 | |||
Long | Short | Long | Short | |
High | 171 | 114 | 120 | 123 |
Low | 98 | 78 | 78 | 62 |
Figure 3: Number of position holders freight futures
Source: SGX, KGI Research
- Others. The number of others with both long and short positions continues to remain stable at 21 each at the end of November.
2024 | 2023 | |||
Long | Short | Long | Short | |
High | 43 | 39 | 53 | 45 |
Low | 20 | 20 | 31 | 25 |
Figure 4: Number of position holders freight futures
Source: SGX, KGI Research
SGX SICOM Rubber Futures – TSR20
Net Long/Short and Price Comparison
We highlight the key price levels that each participants switches their positions between net long and net short based on 2024 data.
2024 | Financial Institution (FI) | Manage Money (MM) | Physicals | Others |
Net Long | Below US$1.90/kg | NA | NA | NA |
Net Short | Above US$1.60/kg | NA | NA | NA |
Net-position WoW Change | Remarks | |
FI | 0.41 | Increase after two consecutive weeks drop |
MM | 2.44 | Largest increase since 6 December 2024 |
Physicals | -3.74 | Largest decrease since 6 December 2024 |
Others | 0.89 | Largest decrease since 6 December 2024 |
Figure 1: Net-positions by participant segment and price comparison
Source: SGX, KGI Research
Long/Short Traders Snapshot
- Managed Money. The number of MM with long positions rebounded slightly to 88, after falling to a low since August 2024. Accordingly, the number of MM with short positions fell for 2 consecutive weeks to 45, after reaching a 5-months high at 56 2 weeks ago. The number of MM with long positions has been on a general downtrend in 2025, following the general rebound in rubber prices in 2025.
2024 | 2023 | |||
Long | Short | Long | Short | |
High | 114 | 56 | 89 | 80 |
Low | 63 | 21 | 25 | 27 |
Figure 2: Number of position holders rubber futures
Source: SGX, KGI Research
- Physicals. The number of physicals with long positions remained stable in 2025, at around its current level at 34. Accordingly, the number of physicals with short positions remained stable in 2025, at around its current level at 39. Seasonally, more physicals are prone to long in early Q3, and there are more physicals with short positions in Q4.
2024 | 2023 | |||
Long | Short | Long | Short | |
High | 39 | 48 | 43 | 39 |
Low | 26 | 28 | 24 | 24 |
Figure 3: Number of position holders rubber futures
Source: SGX, KGI Research
- Others. The number of others with both long and short positions continues in a general downtrend. The number of long holders fell to 47, a low since 2023, while the number of short holders increased slightly since mid-December to 34 currently.
2024 | 2023 | |||
Long | Short | Long | Short | |
High | 77 | 48 | 82 | 51 |
Low | 48 | 26 | 51 | 28 |
Figure 4: Number of position holders rubber futures
Source: SGX, KGI Research
Participant Category | Description |
Financial Institutions | An entity, such as a broker trading desk, bank trading desk or swap dealer, that uses the futures markets to manage or hedge the risk. |
Managed Money | An entity that is engaged in organized futures trading on behalf of funds or other special investment purpose vehicles such as Pension Funds, Asset Managers, Hedge Funds, Proprietary Trading Groups, Family Offices, etc. |
Physicals | An entity that predominantly engages in the physical markets and uses the futures markets to manage or hedge risks associated with the conduct of those activities. Such activities could include the production, processing, trading, packing or handling of a physical commodity, or the provision of transportation, warehousing or distribution services. |
Others | Every other trader that is not placed into one of the other three categories. E.g., Broker Agency, Bank Agency, Inter-Dealer Brokers, etc. |