
28 January 2025: Futures Product Ideas
KGI Weekly Futures Update
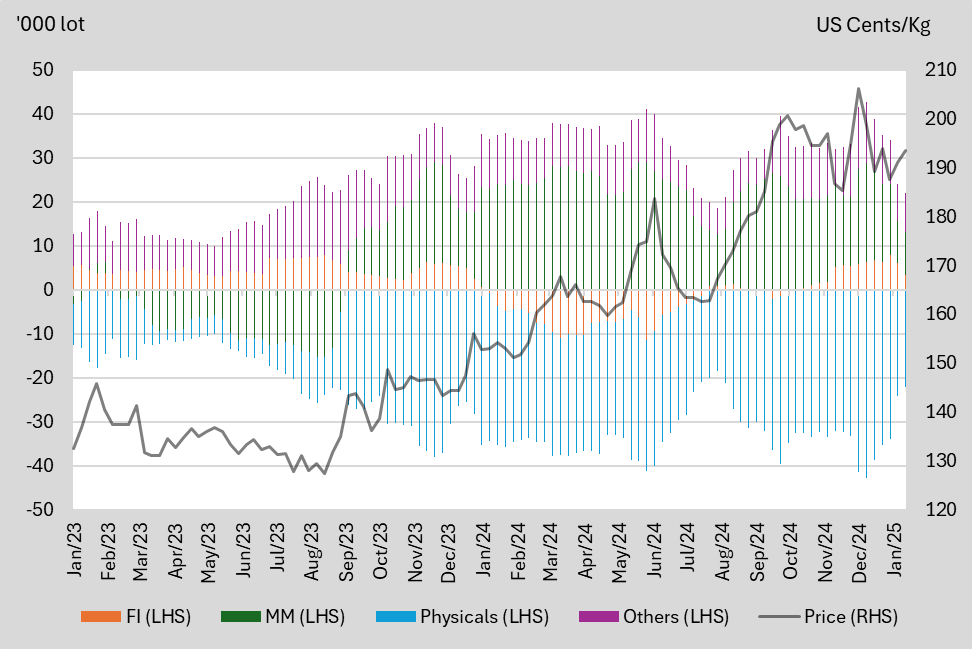
SGX TSI Iron Ore CFR China (62% Fe Fines) Index Futures
Net Long/Short and Price Comparison
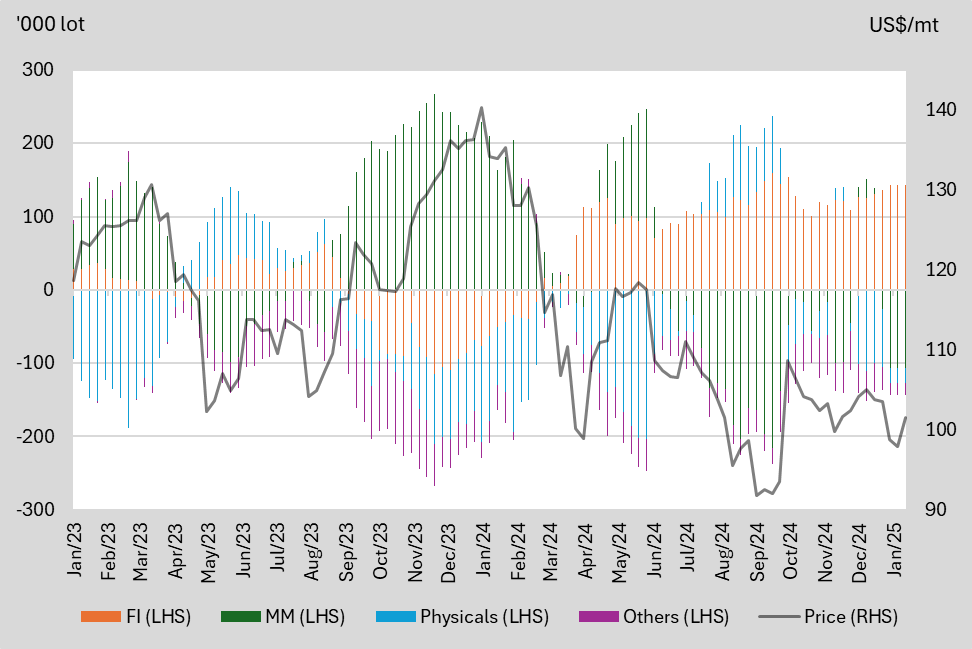
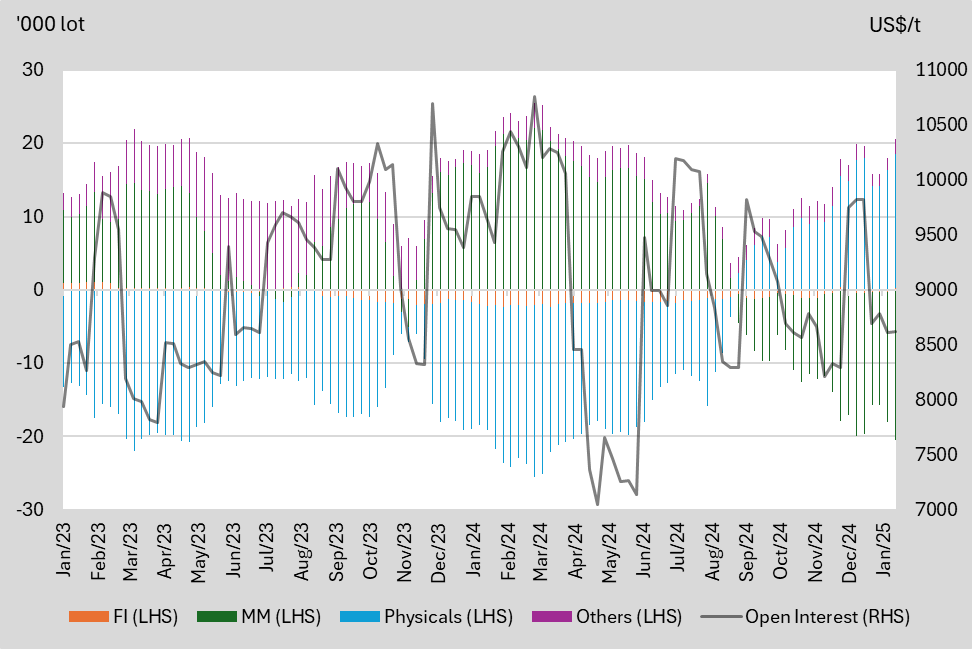
From 2023 to 2024, iron ore prices have been trending downward with increasing volatility. In 2023, prices fluctuated between US$105/mt and US$115/mt. In 2024, prices have ranged from slightly above US$90/mt to slightly above US$140/mt.
We highlight the key price levels that each participants switches their positions between net long and net short based on 2024 data.
|
2024 |
Financial Institution (FI) |
Manage Money (MM) |
Physicals |
Others |
|
Net Long |
Below US$118/mt |
Above US$118/mt |
Below US$100/mt |
NA |
|
Net Short |
Above US$118/mt |
Below US$115/mt |
Above US$100/mt |
NA |
We believe physical traders intend to hedge against the price downturn in 2024, and manged money is a trend follower. Financial institutions are the counterparties of rest participants.
Figure 1: Net-positions by participant segment and price comparison
Source: SGX, KGI Research
Long/Short Traders Snapshot
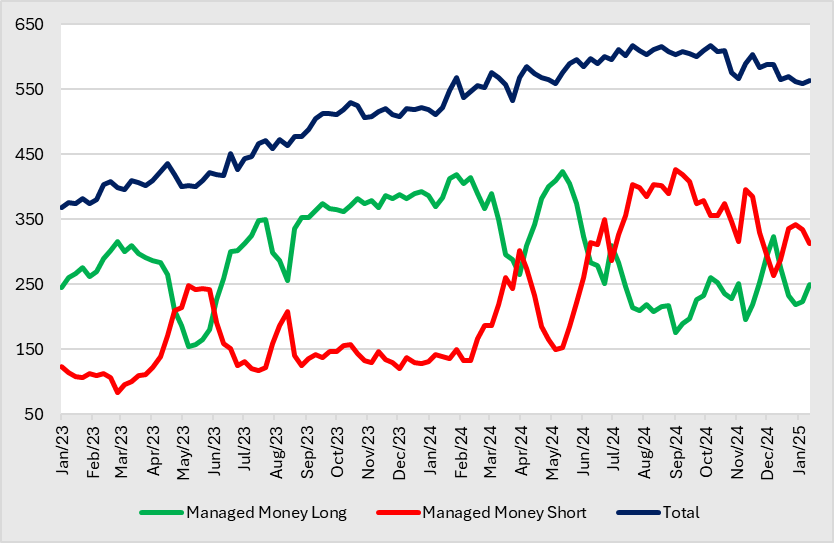
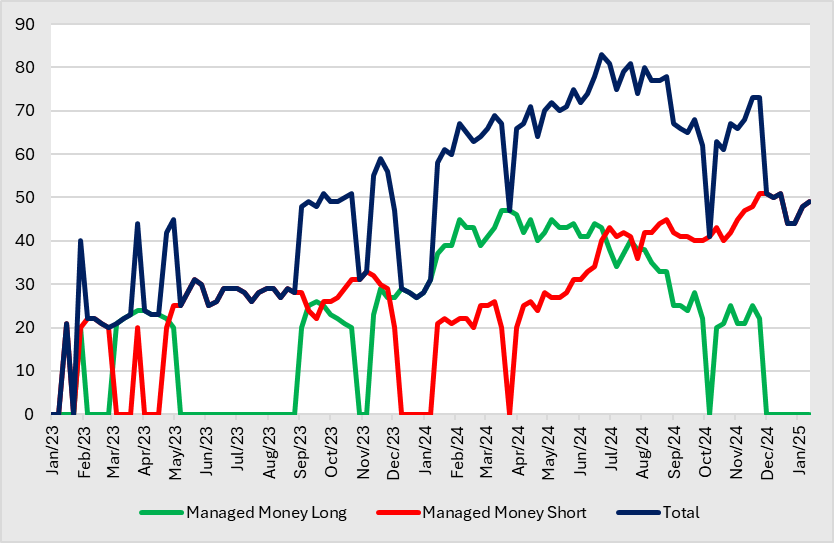
- Managed Money. The number of MM with long positions rebounded for two consecutive weeks to 250, since a low at the start of the year. Accordingly, the number of MM with short positions decreases slightly to 313, a representing a decline for 2 weeks consecutively. Seasonally, More MMs are prone to long in 1HQ4 and 2HQ2, and there are more MMs with short positions in 1HQ2 and 1HQ3.
|
2024 |
2023 | |||
|
Long |
Short |
Long |
Short | |
|
High |
423 |
427 |
393 |
248 |
|
Low |
176 |
131 |
154 |
83 |
Figure 2: Number of position holders iron ore futures
Source: SGX, KGI Research
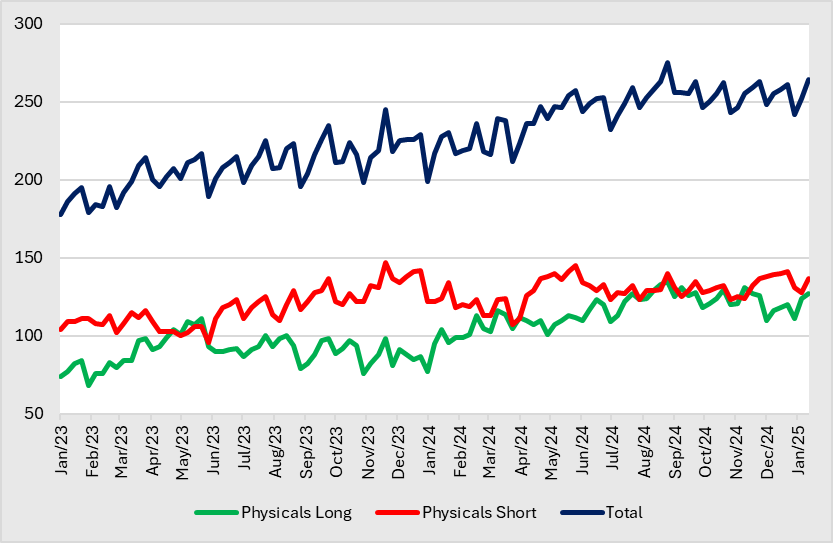
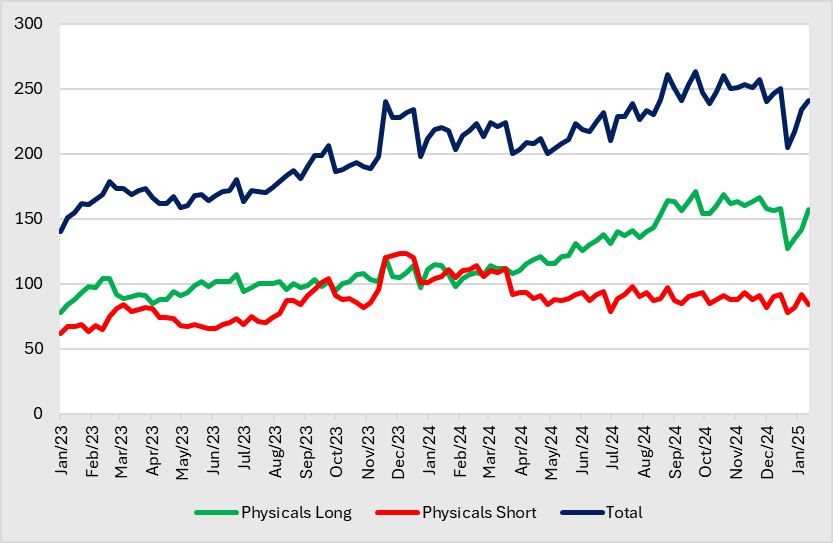
- Physicals. The number of physicals with long positions rose since the start of 2025 at 111 to its current level at 127, representing an increase for 2 consecutive weeks. Contarily, the number of physical with short positions also increased slightly to 137, compared to 131 at the start of 2025. Seasonally, More physicals are prone to long in 1Q, and there are more physicals with short positions in Q4.
|
2024 |
2023 | |||
|
Long |
Short |
Long |
Short | |
|
High |
135 |
145 |
111 |
147 |
|
Low |
77 |
107 |
68 |
96 |
Figure 3: Number of position holders iron ore futures
Source: SGX, KGI Research
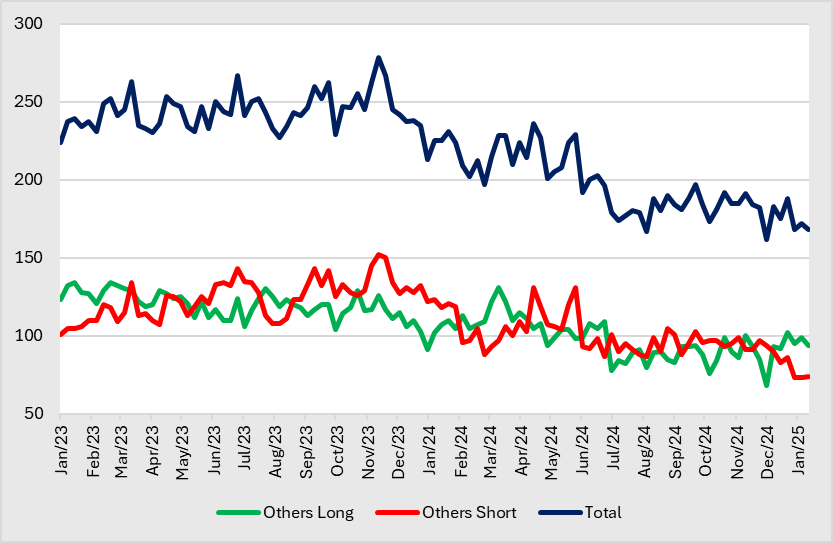
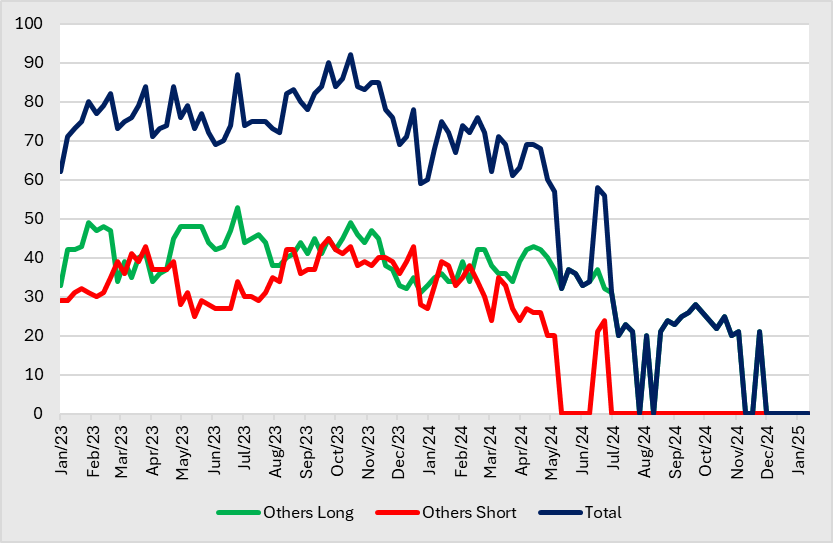
- Others. The number of others with long positions remained stable since the start of 2025 at 94, while the number of others with short positions remained stable at 74 .
|
2024 |
2023 | |||
|
Long |
Short |
Long |
Short | |
|
High |
131 |
131 |
134 |
152 |
|
Low |
68 |
83 |
103 |
101 |
Figure 4: Number of position holders iron ore futures
Source: SGX, KGI Research
SGX Baltic Panamax Time Charter Average Futures
Panamax ships have a 60,000 to 80,000 deadweight tonnage (DWT) capacity, and they’re used mostly to transport coal, grains, and minor bulk products such as sugar and cement. Panamax cargo ships require specialized equipment for loading and unloading. They can barely squeeze through the Panama Canal.
Between 2023 to 2024, Baltic Exchange’s dry bulk sea freight index prices have been volatile, with prices surging more than US$2,500/t to a peak in December 2023 and closing about US$2,000/t lower in December 2024. In 2023, prices fluctuated between US$530/t and US$3,346/t due to demand fluctuations of iron ore and coal from China and Europe. In 2024, prices have ranged from US$1,028/t to slightly above US$2,400/t, largely due to ineffective fiscal and monetary stimulus in China.
Similarly the Baltic Panamax (BPNI) prices surged about US$1,500/t to a peak of US$2,341/t in December 2023 before falling slightly and rebounding back in march 2024 to US$2,234/t. Thereafter it followed a downward trend to close at US$926/t on 13 January 2025.
We believe physical traders intend to hedge against the price downturn in 2024, and manged money is a trend follower. Financial institutions are the counterparties of rest participants.
We highlight the key price levels that each participants switches their positions between net long and net short based on 2024 data.
|
2024 |
Financial Institution (FI) |
Manage Money (MM) |
Physicals |
Others |
|
Net Long |
NA |
Above US$9,000/t |
Below US$8,500/t |
NA |
|
Net Short |
NA |
Below US$9,000/t |
Above US$9,500/t |
NA |
Figure 1: Net-positions by participant segment and price comparison
Source: SGX, KGI Research
Long/Short Traders Snapshot
- Managed Money. The number of MM with long positions remained stable at 22 at the end of November. On the other hand, the number of MM with short positions falls to 44, a low since early November, but recovered in 2025 to its current level at 49. Seasonally, More MM are prone to long in 1H, and there are more MM with short positions in 2H.
|
2024 |
2023 | |||
|
Long |
Short |
Long |
Short | |
|
High |
47 |
51 |
29 |
33 |
|
Low |
20 |
20 |
20 |
20 |
Figure 2: Number of position holders freight futures
Source: SGX, KGI Research
- Physicals. The number of physicals with long positions took a dip in end December, but rebound back in 2025 to its current level at 157. Accordingly, the number of physical with short positions remained stable at 84. The number of physicals is on a general upward trend since 2Q, while physicals with short positions generally saw a downtrend since 2Q.
|
2024 |
2023 | |||
|
Long |
Short |
Long |
Short | |
|
High |
171 |
114 |
120 |
123 |
|
Low |
98 |
78 |
78 |
62 |
Figure 3: Number of position holders freight futures
Source: SGX, KGI Research
- Others. The number of others with both long and short positions continues to remain stable at 21 each at the end of November.
|
2024 |
2023 | |||
|
Long |
Short |
Long |
Short | |
|
High |
43 |
39 |
53 |
45 |
|
Low |
20 |
20 |
31 |
25 |
Figure 4: Number of position holders freight futures
Source: SGX, KGI Research
SGX SICOM Rubber Futures – TSR20
Net Long/Short and Price Comparison
From 2023 to 2025 YTD, rubber prices have been trending upwards with increasing volatility. In 2023, prices fluctuated between US$1.25/Kg and US$1.65/Kg. In 2024, prices have ranged from slightly above US$145/Kg to slightly above US$205/Kg, tracking the ongoing rise in international oil prices and amid persistent concerns about supply prospects. The key Southeast Asian production areas continued to be hit by adverse weather, particularly Thailand. Meanwhile, market participants continued to weigh a subdued global demand outlook, despite new stimulus from top consumer China.
We highlight the key price levels that each participants switches their positions between net long and net short based on 2024 data.
|
2024 |
Financial Institution (FI) |
Manage Money (MM) |
Physicals |
Others |
|
Net Long |
Below US$1.90/kg |
NA |
NA |
NA |
|
Net Short |
Above US$1.60/kg |
NA |
NA |
NA |
We believe Financial Institution intend to hedge against the price downturn in 1H24, before longing in 2H24, following the increasing rubber prices. Physicals tend to hedge against a price downturn throughout the year, while manged money and others are trend followers.
Figure 1: Net-positions by participant segment and price comparison
Source: SGX, KGI Research
Long/Short Traders Snapshot
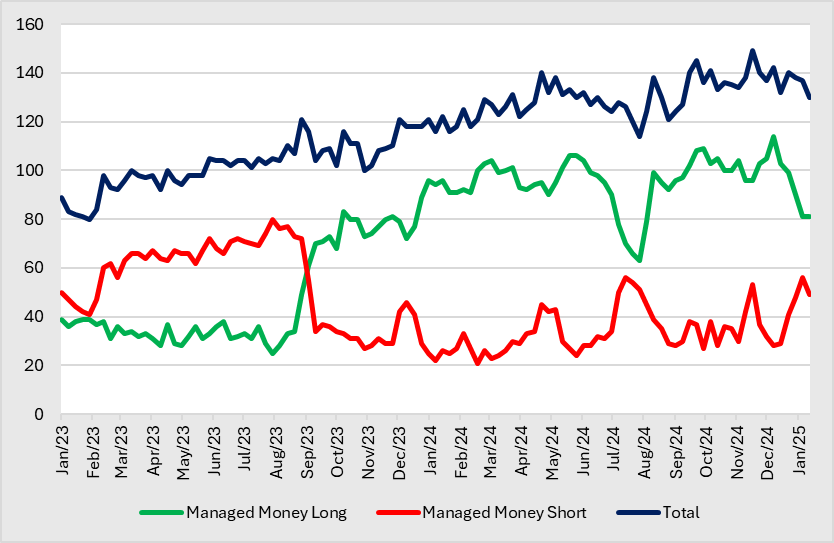
- Managed Money. The number of MM with long positions fell for 5 consecutive weeks to 81, a low since August 2024. Accordingly, the number of MM with short positions rebounded in 2025 to its current level at 49. The number of MM with long positions has been on a general downtrend in 2025, following the general rebound in rubber prices in 2025.
|
2024 |
2023 | |||
|
Long |
Short |
Long |
Short | |
|
High |
114 |
56 |
89 |
80 |
|
Low |
63 |
21 |
25 |
27 |
Figure 2: Number of position holders rubber futures
Source: SGX, KGI Research
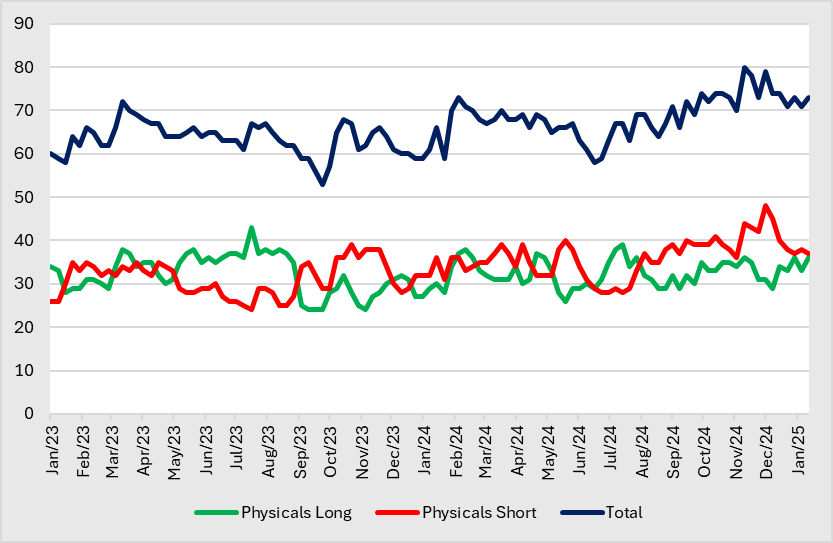
- Physicals. The number of physicals with long positions increased to 36 in 2025, a high since mid-November. Accordingly, the number of physicals with short positions declined for 6 consecutive weeks to 37, a low since early November. Seasonally, More physicals are prone to long in early Q3, and there are more physicals with short positions in Q4.
|
2024 |
2023 | |||
|
Long |
Short |
Long |
Short | |
|
High |
39 |
48 |
43 |
39 |
|
Low |
26 |
28 |
24 |
24 |
Figure 3: Number of position holders rubber futures
Source: SGX, KGI Research
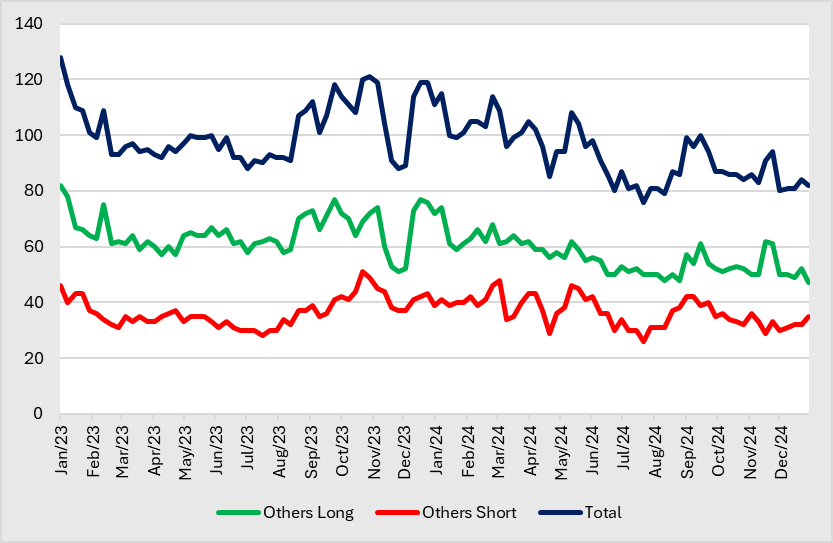
- Others. The number of others with both long and short positions continues in a general downtrend. The number of long holders fell to 47, a low since 2023, while the number of short holders increased slightly since mid-December to 35 currently.
|
2024 |
2023 | |||
|
Long |
Short |
Long |
Short | |
|
High |
77 |
48 |
82 |
51 |
|
Low |
48 |
26 |
51 |
28 |
Figure 4: Number of position holders rubber futures
Source: SGX, KGI Research
|
Participant Category |
Description |
|
Financial Institutions |
An entity, such as a broker trading desk, bank trading desk or swap dealer, that uses the futures markets to manage or hedge the risk. |
|
Managed Money |
An entity that is engaged in organized futures trading on behalf of funds or other special investment purpose vehicles such as Pension Funds, Asset Managers, Hedge Funds, Proprietary Trading Groups, Family Offices, etc. |
|
Physicals |
An entity that predominantly engages in the physical markets and uses the futures markets to manage or hedge risks associated with the conduct of those activities. Such activities could include the production, processing, trading, packing or handling of a physical commodity, or the provision of transportation, warehousing or distribution services. |
|
Others |
Every other trader that is not placed into one of the other three categories. E.g., Broker Agency, Bank Agency, Inter-Dealer Brokers, etc. |