
10 July 2025: Investment Product Ideas
ETF ┃ 10 July 2025
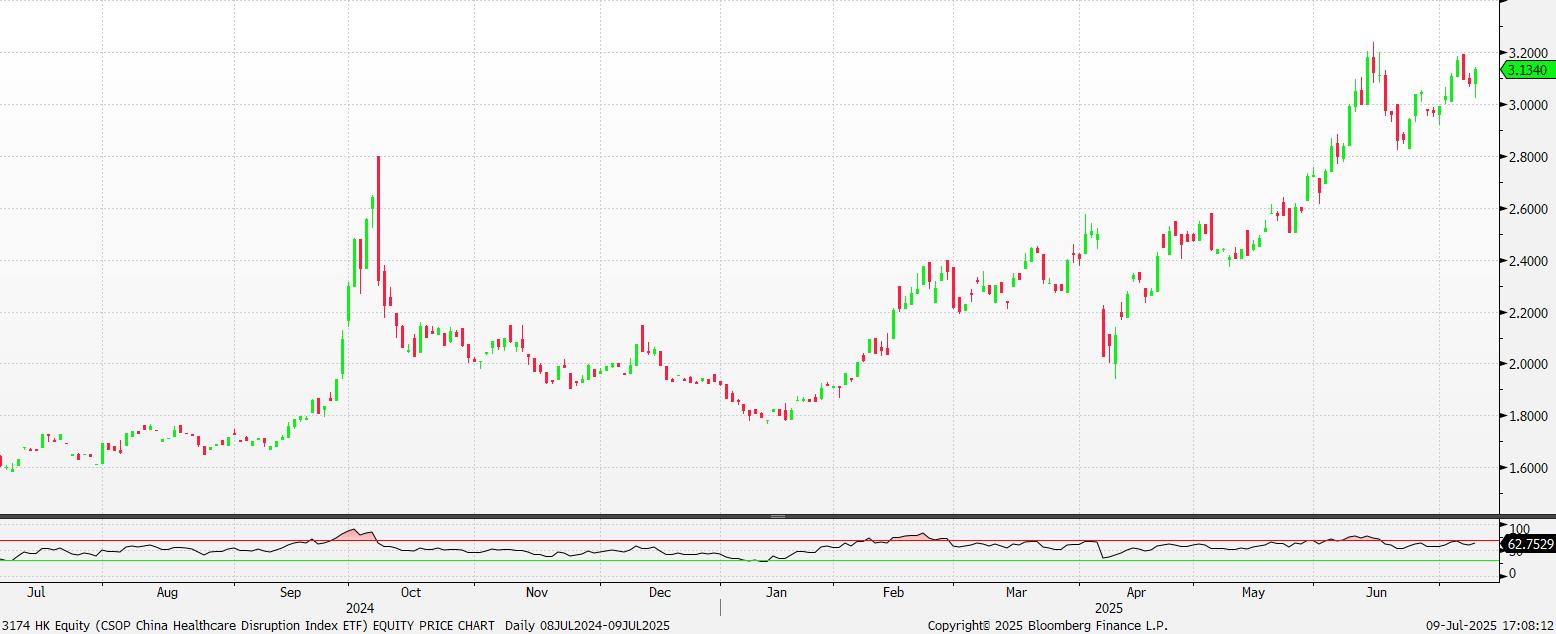
CSOP China Healthcare Disruption Index ETF (3174)
- Targeted exposure to China’s healthcare sector. The CSOP China Healthcare Disruption ETF delivers focused exposure to 22 Hong Kong-listed innovative healthcare names, such as Innovent Biologics, WuXi AppTec and Alibaba Health, benefiting from China’s strong government support via initiatives like Healthy China 2030 and its move to allow foreign healthcare players to wholly own hospitals in certain regions. Furthermore, the trade tensions between the US and China has resulted in talent flowing back to China and creating more research-and-development capability. This thematic ETF offers a powerful way to capitalize on China’s rapid and disruptive biotech transformation.
- Strong performance. With almost HK$830 million in assets and a year-to-date return near 54%, the ETF has demonstrated strong performance and increasing investor confidence. The passive, physical replication strategy ensures cost-effective exposure to disruptive healthcare innovators, offering a low-correlated growth vehicle within traditional portfolios while avoiding stock-picking risk.
|
Fund Name (Ticker) |
CSOP China Healthcare Disruption Index ETF (3174) |
|
Description |
The investment objective of the CSOP China Healthcare Disruption Index ETF (the “Sub-Fund”) is to provide investment results that, before deduction of fees and expenses, closely correspond to the performance of the Index, namely, Solactive China Healthcare Disruption Index (the “Index”). |
|
Asset Class |
Equity |
|
30-Day Average Volume (as of 8 July) |
595, 824 |
|
Net Assets of Fund (as of 8 July) |
HK$828,232,874.64 |
|
12-Month Yield |
N/A |
|
P/E Ratio (as of 8 July) |
44.07x |
|
P/B Ratio (as of 8 July) |
2.60x |
|
Expense Ratio (Annual) |
0.99% |
Top Holdings
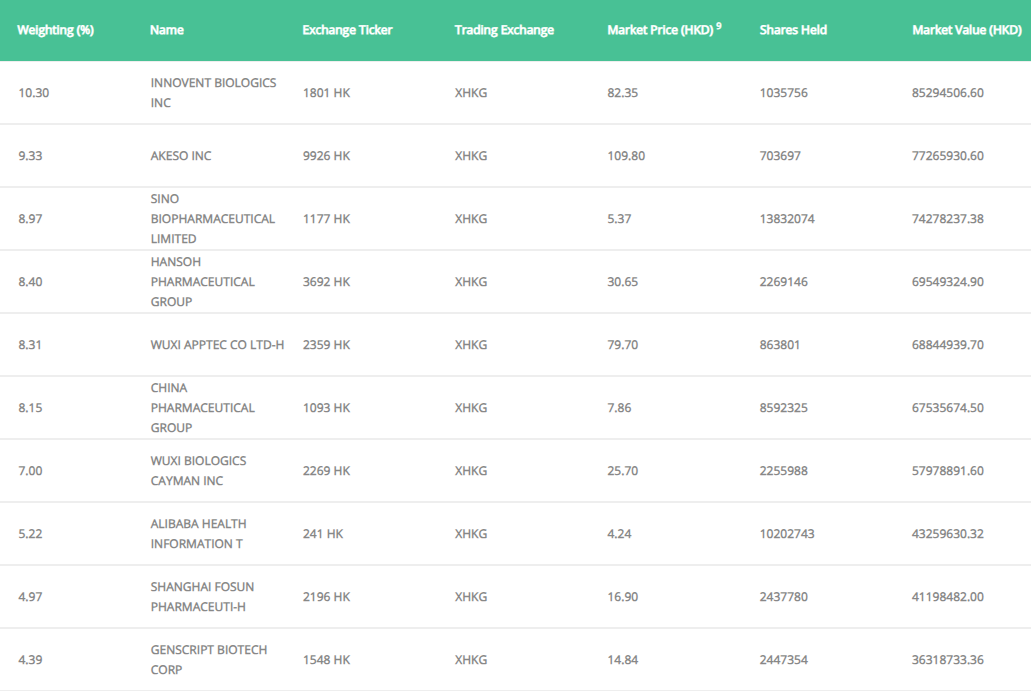
(as of 8 July 2025)

(Source: Bloomberg)

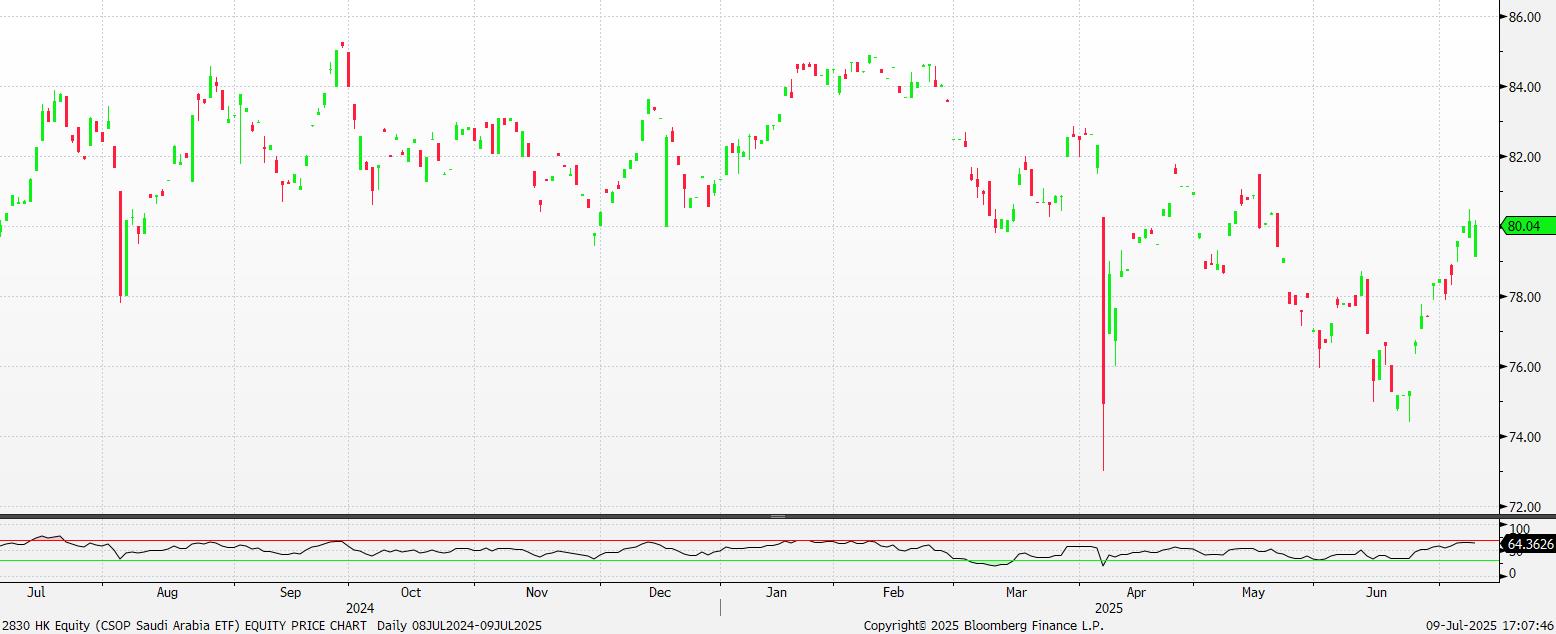
CSOP Saudi Arabia ETF (2830)
- Saudi exposure amid Vision 2030 expansion. The CSOP Saudi Arabia ETF offers broad access to over 60 large and mid-cap companies across key sectors like financials, energy, basic materials, and telecoms, aligned with Saudi Arabia’s Vision 2030 economic transformation. Backed by Saudi Arabia’s Public Investment Fund as anchor investor and benefiting from cross-border connectivity via HK-Saudi Stock Connect, the ETF taps strong regional growth, high dividend yields, and institutional support, offering a compelling diversification opportunity beyond traditional equity markets.
- Capturing emerging market momentum. As Asia-Pacific’s first Saudi equity ETF, this vehicle taps into its broader strategy of opening up markets and attracting foreign capital through ETFs. In 1Q25, its international visitor spending rose 9.7% YoY to SR49.4 billion, reflecting the ongoing expansion of the country’s tourism sector. Additionally, with middle-income and young demographics fuelling economic diversification and structural reforms expanding foreign access, the ETF offers investors a stable alternative correlated with global trade and regional development trends.
|
Fund Name (Ticker) |
CSOP Saudi Arabia ETF (2830) |
|
Description |
The investment objective of the CSOP Saudi Arabia ETF (the “Sub-Fund”) is to provide investment results that, before deduction of fees and expenses, closely correspond to the performance of the FTSE Saudi Arabia Index (net total return version) (the “Underlying Index”). |
|
Asset Class |
Equity |
|
30-Day Average Volume (as of 8 July) |
9,837 |
|
Net Assets of Fund (as of 8 July) |
SR4,895,155,548.04 |
|
12-Month Yield |
N/A |
|
P/E Ratio (as of 8 July) |
18.29x |
|
P/B Ratio (as of 8 July) |
2.23x |
|
Expense Ratio (Annual) |
0.99% |
Top Holdings
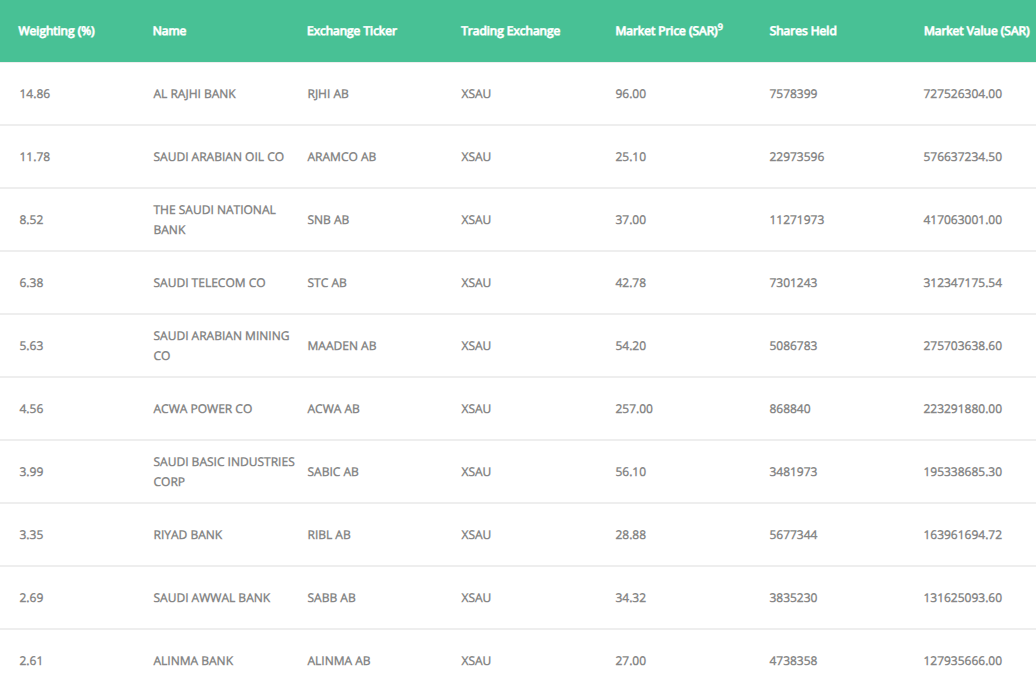
(as of 8 July 2025)

(Source: Bloomberg)

