United States | Singapore | Hong Kong | Earnings

Tamboran Resources Corporation. (TBN US)
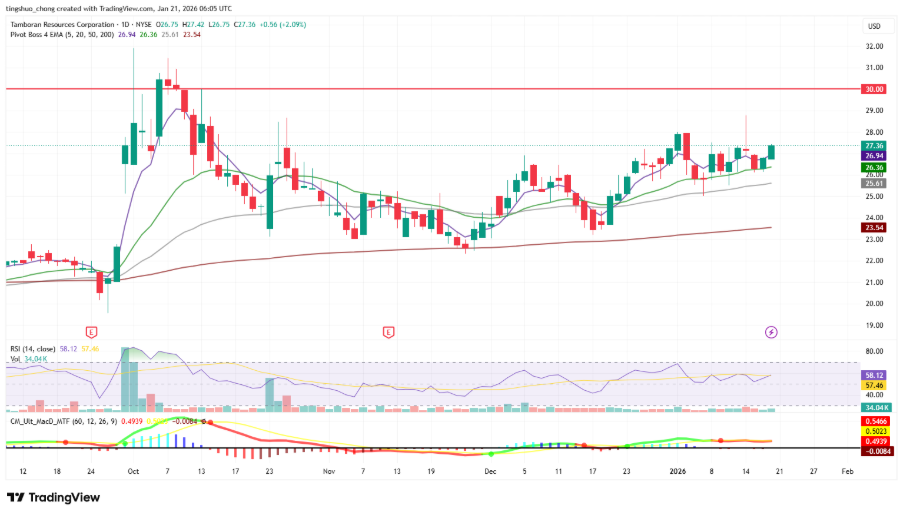
- Shares closed above the 5dEMA.
- Both RSI and MACD are constructive.
- Long – Entry 26, Target 30, Stop 24

Core Natural Resources, Inc. (CNR US)
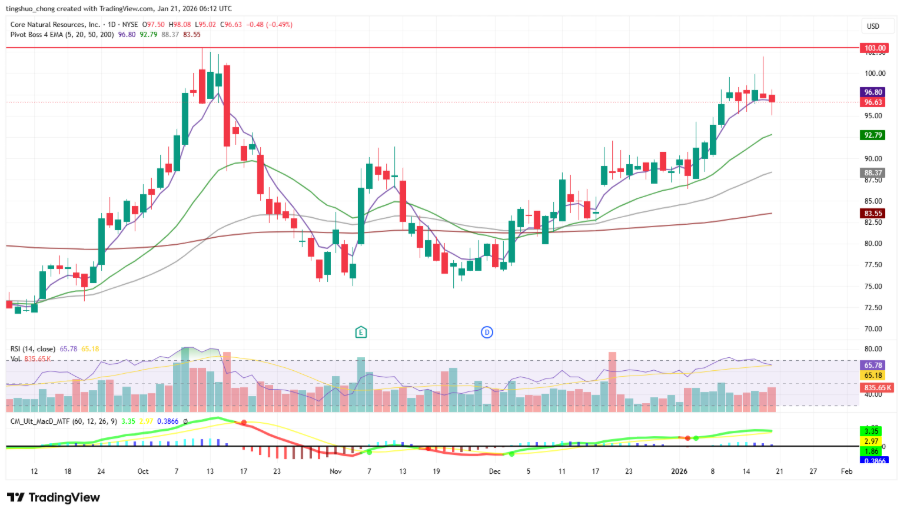
- Shares closed on the 5dEMA with rising volume.
- Both RSI and MACD are constructive.
- Long – Entry 93, Target 103, Stop 88


Wilmar International Limited. (WIL SP)
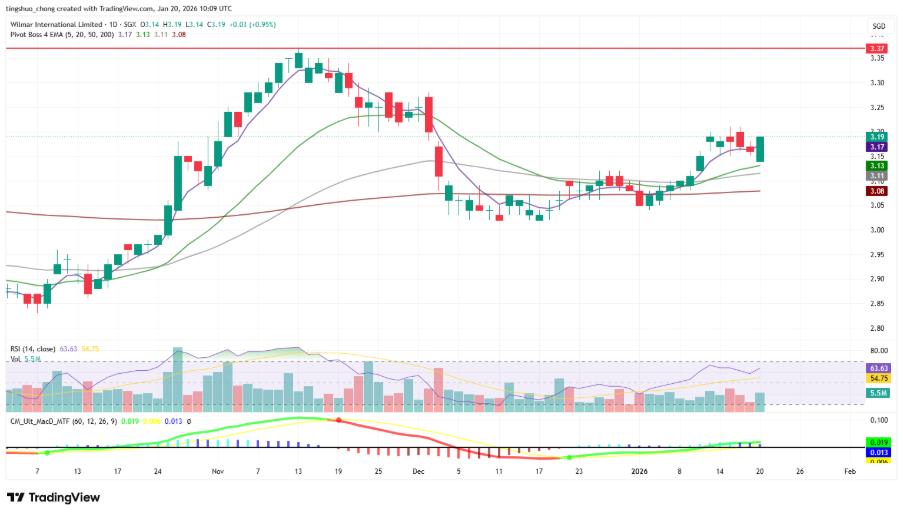
- Shares closed above the 5dEMA with rising volume.
- Both RSI and MACD are constructive
- Buy – Entry 3.11, Target 3.37, Stop 2.98

ValueMax Group Ltd. (VMAX SP)
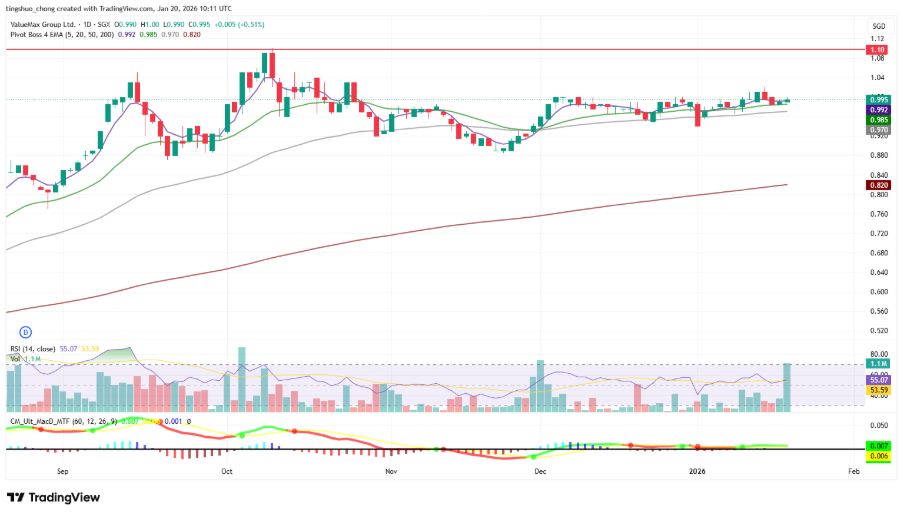
- Shares closed above 5dEMA with elevated volume.
- Both RSI and MACD are constructive.
- Buy – Entry 0.98, Target 1.10, Stop 0.92


KunLun Energy Co. Ltd. (135 HK)
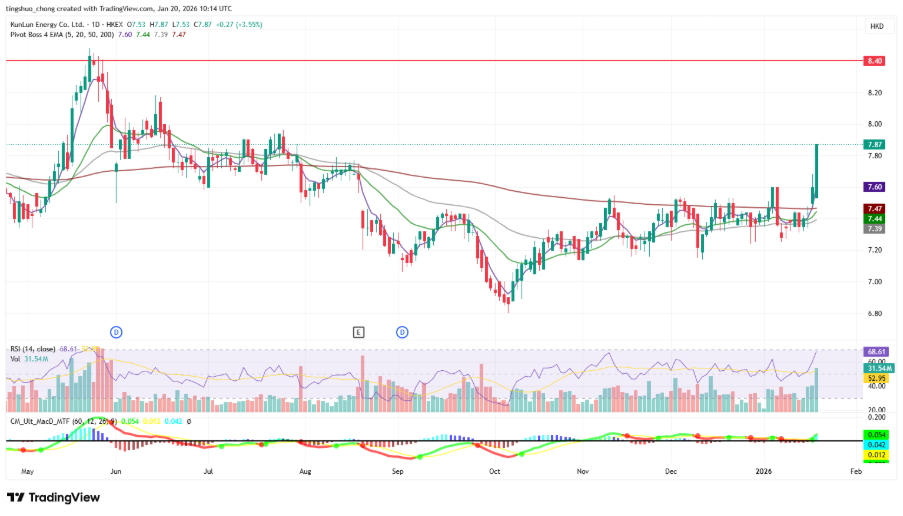
- Shares closed above the 5dEMA with rising volume.
- RSI is slightly overbought, but MACD is constructive.
- Long – Entry 7.6, Target 8.4, Stop 7.2

China Resources Land Limited (1109 HK)
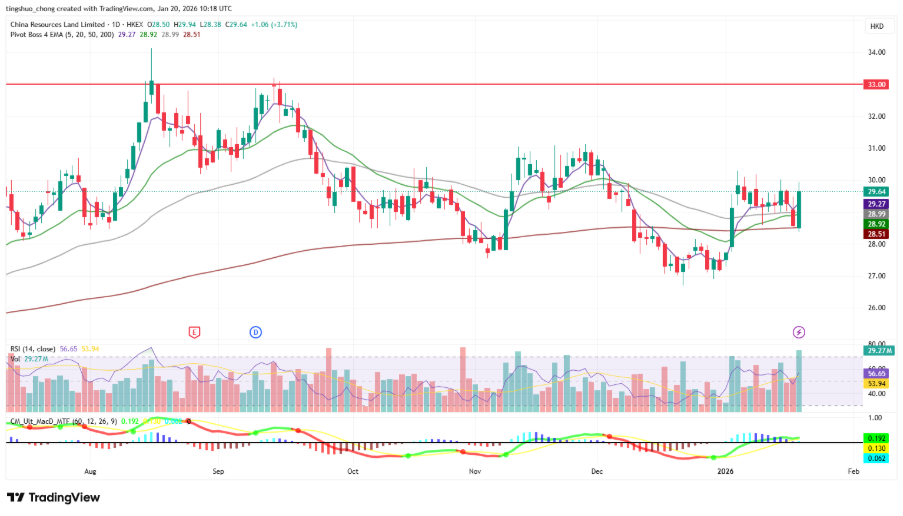
- Shares closed above the 5dEMA with elevated volume.
- Both RSI and MACD are constructive.
- Long – Entry 29, Target 33, Stop 27


3M Company (MMM)
- 4Q25 Revenue: $6B, +2.1% YoY, miss estimates by $10M
- 4Q25 Non-GAAP EPS: $1.83, beat estimates by $0.03
- FY26 Guidance: FY26 adjusted EPS $8.50 to $8.70. Adjusted total sales growth about 4%, reflecting adjusted organic sales growth about 3%. Adjusted operating cash flow $5.6B to $5.8B, with adjusted operating margin expansion of 70 bps to 80 bps
- Dividends: Returned $0.9B to shareholders via dividends and share repurchases in 4Q. Returned $4.8B in FY25.
- Comment: Operationally, the quarter was solid on the metrics that matter for the equity story. Adjusted operating margin improved to 21.1% and adjusted EPS rose to $1.83, while adjusted organic sales growth was 2.2%, consistent with management’s emphasis on operating rigor and commercial execution. GAAP remained noisy. GAAP EPS was $1.07 and GAAP operating margin was 13.0%, pressured by special items including significant litigation costs and PFAS related items, which continues to cap the quality of reported earnings even as adjusted profitability improves. Demand picture was mixed by end market. Consumer remained weak with another sales decline, while industrial oriented lines were more resilient. The stock sold off sharply on January 20, 2026 despite the beat, as investors anchored on a slightly light FY26 EPS midpoint versus consensus and incremental tariff uncertainty. Management flagged a potential $30M to $40M earnings headwind from newly threatened tariffs that is not yet embedded in guidance, which widened the range of outcomes for 2026 execution. What to watch next is whether adjusted organic growth sustains around the low single digit level without further consumer deterioration, and whether margin expansion stays on track as pricing, productivity, and mix offset inflation and any tariff pass through. Key swing factors are the cadence of litigation and PFAS cash outflows, the realized tariff regime, and the slope of end demand in Consumer and Electronics exposed lines. 1Q26 recommended trading range: $140 to $170. Neutral Outlook.
3M公司(MMM)
- 25财年第四季度营收:60亿美元,同比增长2.1%,低于预期1000万美元
- 25财年第四季度非公认会计准则每股收益:1.83美元,超出预期0.03美元
- 26财年全年指引:调整后每股收益8.50至8.70美元;调整后总销售额增长约4%(其中有机销售额增长约3%);调整后经营活动现金流56亿至58亿美元;调整后营业利润率扩张70至80个基点
- 股息与资本返还:第四季度通过股息和股票回购向股东返还9亿美元;25财年全年累计返还48亿美元
- 短评:从支撑股权价值的核心运营指标看,本季度表现稳健。调整后营业利润率提升至21.1%,调整后每股收益达1.83美元,调整后有机销售额增长2.2%,符合管理层强调的运营纪律与商业化执行力。但公认会计准则(GAAP)数据仍受干扰:GAAP每股收益为1.07美元,GAAP营业利润率仅为13.0%,主因包括重大诉讼费用及PFAS相关事项在内的特殊项目持续拖累,即便调整后盈利能力改善,整体财报质量仍受限。终端市场需求分化明显:消费品板块延续疲软,再度录得销售下滑;而工业导向业务线更具韧性。尽管盈利超预期,股价在2026年1月20日仍大幅下跌,主因投资者聚焦于26财年每股收益指引中值略低于市场共识,以及新增关税不确定性。管理层提示,新近威胁加征的关税可能带来3000万至4000万美元的盈利压力,该影响尚未纳入当前指引,扩大了2026年业绩兑现的潜在波动区间。后续需重点关注:调整后有机增长能否维持在低个位数水平,且不因消费品需求进一步恶化而承压;以及在通胀与潜在关税成本传导下,定价、生产效率与产品结构优化能否持续推动利润率扩张。关键变量包括:诉讼与PFAS相关现金流出节奏、实际落地的关税政策,以及消费品与电子相关业务终端需求的斜率变化。26财年第一季度建议交易区间:140美元至170美元。中性前景。
D.R. Horton, Inc. (DHI)
- 1Q26 Revenue: $6.89B, -9.3% YoY, beat estimates by $240M
- 1Q26 GAAP EPS: $2.03, beat estimates by $0.11
- FY26 Guidance: Reiterated FY26 consolidated revenue $33.5B to $35.0B and homebuilding closings 86,000 to 88,000. Tax rate about 24.5%. Operating cash flow at least $3.0B. Planned share repurchases about $2.5B and dividend payments about $500M
- Dividends: Declared quarterly dividend of $0.45 per share payable February 12, 2026. Repurchased 4.4M shares for $669.7M in 1Q and paid $131.5M of dividends
- Comment: The quarter showed resilient demand response to incentives, but at the cost of margin compression. Net sales orders rose 3% to 18,300 homes and cancellation rate held at 18%, while order value stayed at $6.7B, which suggests the company is defending pace with affordability support rather than price led growth. Volume and revenue were down YoY. Home sales revenue fell to $6.5B on 17,818 closings versus $7.1B on 19,059 closings last year, and consolidated revenue was $6.9B, consistent with a softer demand backdrop despite the order growth. Gross margin is the key swing factor. Home sales gross margin was 20.4% and management framed incentives as increasing through the quarter, with 2Q home sales gross margin guided to 19% to 19.5% alongside 2Q consolidated revenue of $7.3B to $7.8B and 2Q closings of 19,700 to 20,200. Balance sheet capacity remains a differentiator. Operating cash flow was $854.0M, liquidity was $6.6B, and debt to total capital was 18.8%, which supports continued buybacks even if margin pressure persists. The print was an EPS and revenue beat with FY guidance reaffirmed, but the market focus shifted quickly to the forward margin setup and incentives. Shares were volatile post print and are down about 2% on the latest session data, consistent with investors discounting the 2Q margin guide and still cautious buyer behavior. What to watch next is the spring selling season elasticity, the slope of incentives, and whether DHI can stabilize gross margin near 19% to 19.5% while scaling starts and closing volume. The upside case needs rate relief and better demand conversion without incremental incentive intensity, while the downside case is a longer period of elevated incentives that caps return despite strong scale and liquidity. 2Q26 recommended trading range: $140 to $180. Neutral Outlook.
D.R. Horton公司(DHI)
- 26财年第一季度营收:68.9亿美元,同比下降9.3%,超出预期2.4亿美元
- 26财年第一季度公认会计准则每股收益:2.03美元,超出预期0.11美元
- 26财年全年指引:重申全年合并营收335亿至350亿美元,房屋交付量86,000至88,000套;有效税率约24.5%;经营活动现金流至少30亿美元;计划股票回购约25亿美元,股息支付约5亿美元
- 股息与资本返还:宣布季度股息每股0.45美元,将于2026年2月12日派发;第一季度回购440万股股票,耗资6.697亿美元,并支付股息1.315亿美元
- 短评:本季度显示需求对促销激励反应具韧性,但以毛利率压缩为代价。净销售订单同比增长3%至18,300套,取消率稳定在18%,订单总值维持在67亿美元,表明公司主要通过提升可负担性(而非提价)来维持销售节奏。销量与收入同比下滑:房屋销售收入从去年同期的71亿美元(19,059套交付)降至65亿美元(17,818套交付),合并营收为68.9亿美元,反映尽管订单增长,整体需求环境仍偏弱。毛利率是核心变量:房屋销售毛利率为20.4%,管理层指出促销力度在季度内持续加大;并指引第二财季房屋销售毛利率将降至19%至19.5%,同期合并营收预计73亿至78亿美元,交付量19,700至20,200套。资产负债表实力仍是差异化优势:经营活动现金流8.54亿美元,流动性达66亿美元,净负债占总资本比例仅18.8%,支撑公司在利润率承压环境下继续执行回购。尽管本季盈利与营收均超预期且全年指引维持不变,市场焦点迅速转向前瞻毛利率指引及激励强度。财报发布后股价波动,最新交易日下跌约2%,反映投资者对第二财季毛利率指引的折价以及对购房者行为仍持谨慎态度。后续需重点关注:春季销售旺季的需求弹性、促销力度的变化斜率,以及公司能否在扩大开工与交付规模的同时,将毛利率稳定在19%至19.5%区间。上行情景需利率缓解及需求转化改善(无需进一步加码促销);下行情景则为高激励周期延长,即便规模与流动性强劲,回报率仍受压制。26财年第二季度建议交易区间:140美元至180美元。中性前景。
Netflix, Inc. (NFLX)
- 4Q25 Revenue: $12.05B, +17.6% YoY, beat estimates by $80M
- 4Q25 GAAP EPS: $0.56, beat estimates by $0.01
- 1Q26 Guidance: 1Q26 revenue $12.16B and diluted EPS $0.76, with operating margin 32.1%
- FY26 Guidance: FY26 revenue $50.7B to $51.7B and operating margin 31.5%
- Dividends: Repurchased 18.9M shares for $2.1B in 4Q and had $8.0B remaining under authorization, but plans to pause buybacks to accumulate cash for the pending Warner Bros. transaction
- Comment: Q4 delivered a clean beat with revenue up 18% YoY and operating income up 30% YoY, while operating margin expanded to 24.5%. Net income was $2.42B and free cash flow was $1.87B in the quarter. Scale and monetization both contributed. Netflix crossed 325M paid memberships, and advertising revenue grew more than 2.5x in 2025 to over $1.5B, with management projecting a rough doubling again in 2026. Regional growth stayed broad based. UCAN revenue rose 18% YoY to $5.34B, EMEA rose 18% to $3.87B, LATAM rose 15% to $1.42B, and APAC rose 17% to $1.42B. Cash generation remains strong. FY25 free cash flow was $9.5B, and FY26 free cash flow is guided to roughly $11B, with operating margin targeted at 31.5% despite ~ $275M of acquisition related expenses embedded in the plan. Shares traded lower after the print as the 1Q outlook came in slightly below consensus on EPS despite the Q4 beat. What to watch next is the pace of advertising monetization, the sustainability of margin expansion given the step up in 1Q operating margin, and the degree to which capital allocation shifts away from buybacks while the pending transaction is funded. Key swing factors are pricing power, ad load and CPM trajectory, and content amortization timing that can back end operating income growth through 2026. 1Q26 recommended trading range: $60 to $100. Negative Outlook.
奈飞公司(NFLX)
- 25财年第四季度营收:120.5亿美元,同比增长17.6%,超出预期8000万美元
- 25财年第四季度公认会计准则每股收益:0.56美元,超出预期0.01美元
- 26财年第一季度指引:营收121.6亿美元,摊薄每股收益0.76美元,营业利润率32.1%
- 26财年全年指引:营收507亿至517亿美元,营业利润率31.5%
- 股息与资本返还:第四季度回购1890万股股票,耗资21亿美元;截至季末,剩余授权回购额度为80亿美元;但公司计划暂停股票回购,以积累现金用于即将完成的华纳兄弟(Warner Bros.)交易
- 短评:第四季度表现稳健——营收同比增长18%,营业利润同比增长30%,营业利润率扩大至24.5%;净利润达24.2亿美元,自由现金流为18.7亿美元。增长由规模扩张与变现能力双轮驱动:付费会员数突破3.25亿;广告收入在2025年增长逾2.5倍,超过15亿美元,管理层预计2026年将再度翻倍。区域增长保持均衡:北美及拉美(UCAN)收入同比增长18%至53.4亿美元,欧洲、中东和非洲(EMEA)增长18%至38.7亿美元,拉丁美洲(LATAM)增长15%至14.2亿美元,亚太(APAC)增长17%至14.2亿美元。现金流持续强劲:25财年自由现金流达95亿美元,26财年指引约为110亿美元,尽管全年已包含约2.75亿美元与收购相关的费用。尽管第四季度业绩超预期,股价仍下跌,主因第一季度每股收益指引略低于市场共识。后续需重点关注:广告变现加速节奏、在第一季度营业利润率显著跃升后利润率扩张的可持续性,以及在为重大交易储备现金期间,资本配置重心从回购向战略投资的转移程度。关键变量包括:定价能力、广告加载量与CPM(每千次展示成本)走势,以及内容摊销节奏可能使2026年营业利润增长呈现后置特征。26财年第一季度建议交易区间:60美元至100美元。负面前景。
United Airlines Holdings, Inc. (UAL)
- 4Q25 Revenue: $15.4B, +5.0% YoY, beat estimates by $60M
- 4Q25 Non-GAAP EPS: $3.10, beat estimates by $0.16
- 1Q26 Guidance: 1Q26 adjusted EPS $1.00 to $1.50
- FY26 Guidance: FY26 adjusted EPS $12.00 to $14.00
- Comment: United printed record quarterly revenue despite a roughly $250M pre-tax hit tied to the government shutdown impact. Net income was $1.0B and adjusted pre-tax margin was 8.5%. Mix and monetisation continued to skew premium. Premium revenue rose 9% YoY and loyalty revenue rose 10% YoY in 4Q, while Basic Economy revenue grew 7%. Unit economics were a bit noisy given growth. Capacity rose 6.5% YoY and TRASM fell 1.6% YoY, while CASM ex fuel rose 0.4% YoY. Average fuel price was $2.49 per gallon. Cash generation and leverage were stable at the full year level. FY25 operating cash flow was $8.4B and free cash flow was $2.7B, with net leverage at 2.2x. Management expects a similar level of free cash flow in 2026. The 2026 setup leans constructive on demand and capacity optionality. Management flagged record passenger revenue from flown tickets in the week ending Jan 4 and guided 1Q26 EPS above consensus, with planned fleet deliveries (100 plus narrowbodies and about 20 787s) supporting network flexibility. Shares moved up about 4% after hours on the profit beat and above consensus 1Q guide, with the read through that premium and loyalty momentum is still doing the heavy lifting. Near term debate should centre on whether TRASM pressure is transitory (capacity growth and mix) versus signalling softer price realisation in the main cabin, and whether cost control stays tight as the fleet ramps. Execution risk also sits around operational investments and any renewed policy or macro shocks that hit demand or system reliability. 1Q26 recommended trading range: $95 to $125. Neutral Outlook.
美国联合航空控股公司(UAL)
- 25财年第四季度营收:154亿美元,同比增长5.0%,超出预期6000万美元
- 25财年第四季度非公认会计准则每股收益:3.10美元,超出预期0.16美元
- 26财年第一季度指引:调整后每股收益1.00至1.50美元
- 26财年全年指引:调整后每股收益12.00至14.00美元
- 短评:尽管受政府停摆影响导致税前利润减少约2.5亿美元,公司仍创下单季营收历史新高。净利润达10亿美元,调整后税前利润率为8.5%。收入结构持续向高价值客群倾斜:第四季度高端舱位收入同比增长9%,忠诚度计划收入增长10%,基础经济舱收入亦增长7%。单位经济效益因运力扩张略显波动:可用座位里程(ASK)同比增长6.5%,每可用座位里程总收入(TRASM)同比下降1.6%;剔除燃油后的每可用座位里程成本(CASM ex fuel)微升0.4%;平均燃油价格为每加仑2.49美元。全年现金流与杠杆水平保持稳健:25财年经营活动现金流84亿美元,自由现金流27亿美元,净杠杆率维持在2.2倍;管理层预计2026年自由现金流将维持相近水平。2026年前景整体偏积极,需求与运力调配具备弹性:管理层指出截至1月4日当周已实现创纪录的机票收入,并给出高于市场共识的第一季度每股收益指引;年内计划交付超100架窄体机及约20架波音787宽体机,将增强网络灵活性。受盈利超预期及一季度指引优于预期推动,盘后股价上涨约4%,反映市场认可高端客源与忠诚度业务仍是当前增长核心驱动力。短期焦点在于:TRASM压力是暂时性因素(由运力增速与客源结构变化所致),抑或预示主舱位定价能力走弱;以及在机队快速扩张背景下,成本控制能否维持纪律。执行风险亦需关注:运营投资效率、以及潜在政策变动或宏观冲击对需求或系统可靠性的扰动。26财年第一季度建议交易区间:95美元至125美元。中性前景。

