
Technical Analysis: Hang Seng Index (HSI)
| Open | 25,795.17 |
| Close | 25,628.75 |
| High | 25,795.17 |
| Low | 25,555.17 |
| Change | -409.53 (-1.57%) |
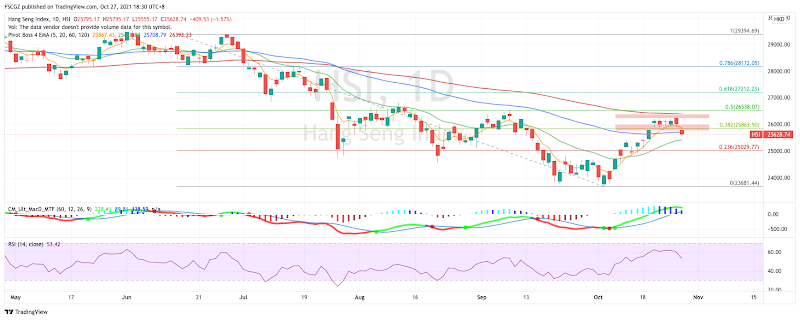
- After gapping up on 20th October, HSI consolidated for four days with a tight range of around 400 points. Major US market indexes broke new highs, but the bullish sentiment did not help HSI to continue the rally, implying that short selling forces remained strong.
- On 27th October, HSI gapped down with an opening price close to the closing price on 19th October. Technically, this formed an island reversal pattern. The closing price was near the intraday low. Meanwhile, it broke below the two support levels of 1). 60dEMA of 25699, 2). 0.618Fibonacci level of 25864. Hence, HSI is showing a bearish outlook in the near term.
- There are two resistance levels: 1) 5dEMA of 25868, 2) 26th October’s closing price of 26038 (HSI needs to fill the gap to confirm the resumption of the uptrend).
- There are two support levels: 1) 20dEMA of 25122, 2). 0.236 Fibonacci level of 25030.
Recommendation:
- HSI has shown short-term weakness as it failed to break the key resistance level of 120dEMA and left gaps which implied a strong shorting pressure above.
- Investors who remain bullish should be patient and wait for it to drop back to around 25000. If HSI manages to reverse from 25000, then it will form an inverted head-and shoulder pattern which is a positive sign for the next uptrend.
- Long – Entry: 25,030, Target: 25,864, Stop: 24,583
- Short – Entry: 26,420, Target: 26,075, Stop: 26,560

Related Posts: