INVESTMENT PRODUCT IDEAS

30 July 2026: Investment Product Ideas

ETF 1  | ETF 2

ETF Recommendation 1

FUND NAME AND TICKER

iShares MSCI Europe Financials ETF (EUFN.US)

DESCRIPTION

Tracks the MSCI Europe Financials Index, aiming to replicate its performance.

Pure Exposure to European Banks

This ETF tracks European financial stocks, making it suitable for investors who want concentrated exposure to the region’s financial industry.

Attractive Valuations

European financial institutions span banks, insurance, asset management, and fintech, with operations across the EU and global markets. This diversification enhances resilience, while European financials generally trade at lower P/E ratios than U.S. peers, making them more appealing in global asset allocation.

Morningstar Rating

With a Beta of just 0.63 and a three‑year standard deviation of about 15.60%, the ETF provides regional financial exposure while helping reduce overall portfolio volatility.

ASSET CLASS

Shares

30-DAY AVERAGE VOLUME
0
NET ASSETS OF FUND (AS OF 28 JULY)
USD $ 0 M
12-MONTH YIELD (AS OF 30 JUNE)
0 %
P/E RATIO (AS OF 27 July)
0
P/B RATIO (AS OF 27 July)
0
EXPENSE RATIO (ANNUAL)
0 %

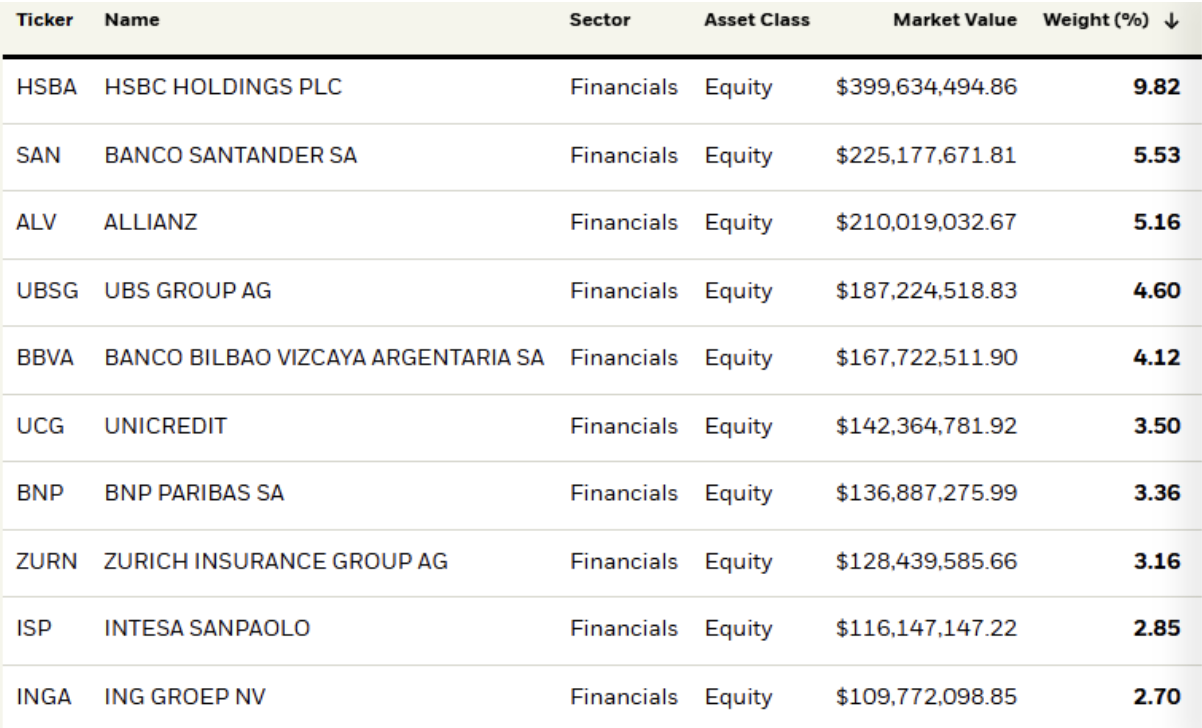
TOP HOLDINGS

(as of 27 July 2026)

YEAR TO DATE RETURNS

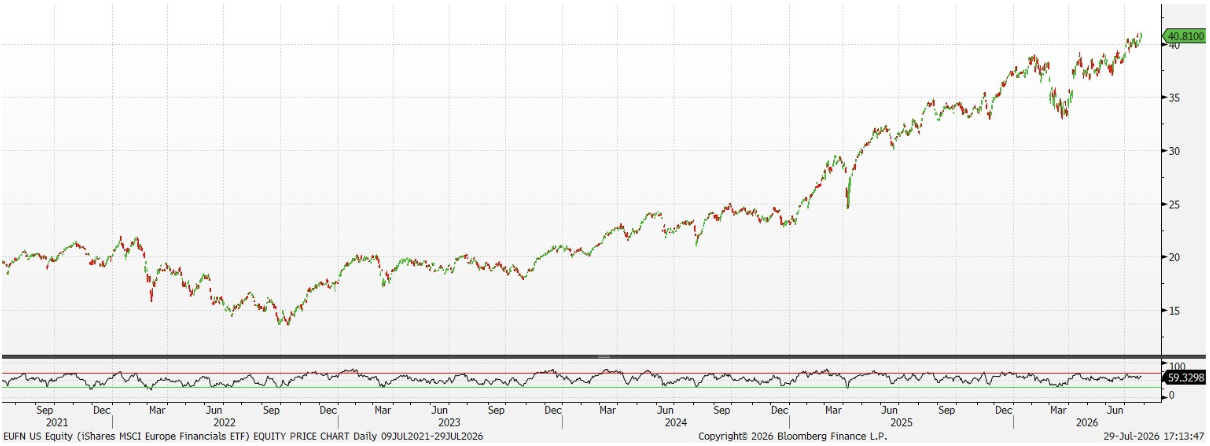
PRICE CHART

(Source: Bloomberg)

ETF Recommendation 2

FUND NAME AND TICKER

iShares U.S. Financials ETF (IYF US)

DESCRIPTION

This ETF tracks the Russell 1000 Financials 40 Act 15/22.5 Daily Capped Index, seeking to replicate the performance of its constituent securities.

High Concentration in Core Holdings

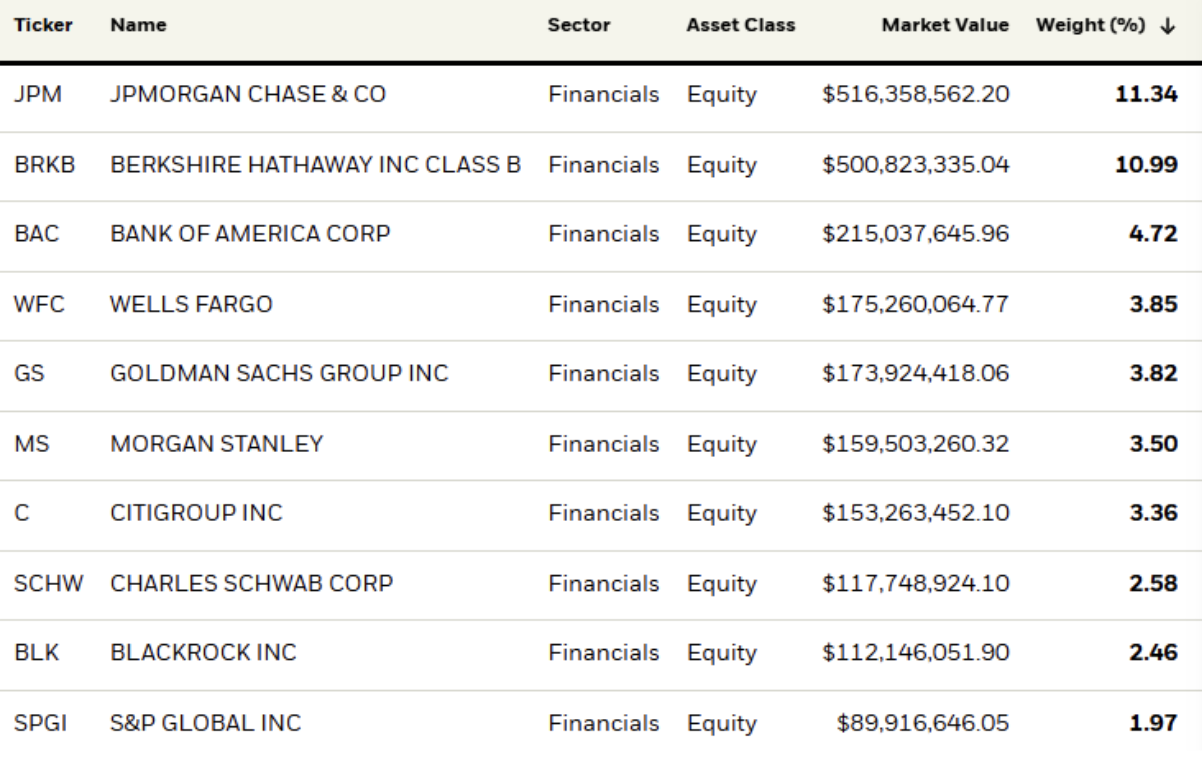
The ETF’s top ten holdings cover major U.S. financial leaders, accounting for nearly 49%. This allows investors to directly benefit from the performance of industry giants, particularly as interest rates and regulatory shifts quickly influence sector trends.

Clear Industry Purity

The ETF holds more than 2,000 bonds, with the top 10 positions accounting for only about 2.49% of the portfolio, helping reduce concentration risk.

Long-Term Performance and Risk Profile

Since its inception in 2000, the ETF has delivered a 10‑year annualized return of about 12.7%, underscoring the resilience of the financial sector. With a Beta near 1.0 and volatility comparable to the broader market, it serves as a balanced tool for sector allocation.

ASSET CLASS

Shares

30-DAY AVERAGE VOLUME
0
NET ASSETS OF FUND (AS OF 28 July)
USD $ 0
12-MONTH YIELD (AS OF 30 june)
0 %
P/E RATIO (AS OF 27 JULY)
0
P/B RATIO (AS OF 27 JULY)
0
EXPENSE RATIO (ANNUAL)
0 %

TOP HOLDINGS

(as of 27 July 2026)

YEAR TO DATE RETURNS

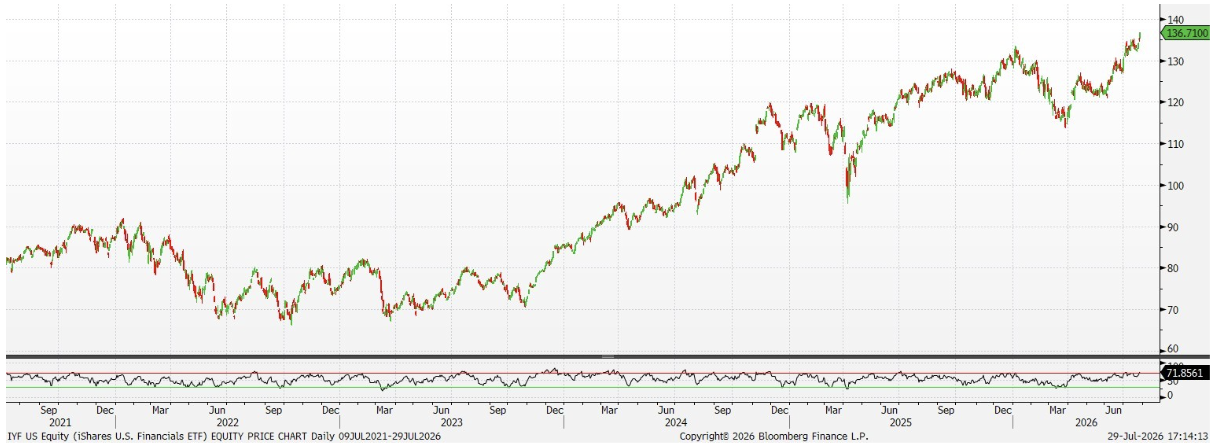
PRICE CHART

(Source: Bloomberg)