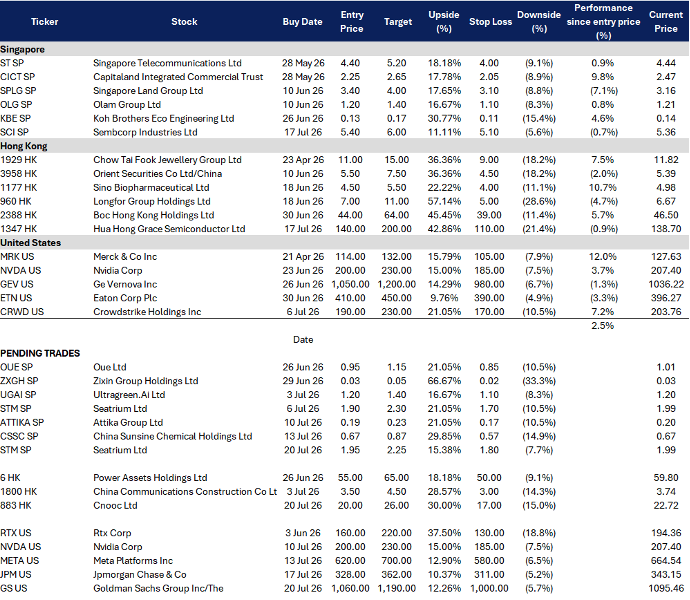

STM SP
Backlog conversion, FPSO execution, and legacy-risk clean-up
KEY INSIGHTS #1
Offshore capex stays supportive, with FPSOs providing the earnings backbone.
Seatrium is positioned for the continuing deepwater investment cycle, where operators are prioritising large, long-life production assets. Its Petrobras P-84 and P-85 FPSO projects provide substantial multi-year workload through 2029, while the broader order book extends revenue visibility to 2033. The key attraction is not merely higher order intake, but exposure to complex projects where Seatrium has established engineering and fabrication capabilities.
KEY INSIGHTS #2
Legacy risk is declining, allowing investors to focus on operating execution.
The settlement of the Maersk offshore-wind vessel dispute removed a major uncertainty. Maersk agreed to pay the remaining US$360M on the US$475M contract, including US$250M through an interest-bearing credit arrangement, while both parties discontinued legal proceedings. With the vessel approximately 99.8% complete at settlement, this significantly reduces downside from one of Seatrium’s most visible legacy exposures.

SCI SP
Alinta transforms the earnings base, renewables scale continues, but near-term margins face a reset
KEY INSIGHTS #1
Alinta creates a second core market and materially expands the earnings platform. Sembcorp completed its acquisition of Alinta Energy on 11 June 2026.
Alinta adds 3.4GW of operating capacity, approximately 1.1 million Australian customers and a 10.4GW development pipeline, establishing Australia as Sembcorp’s second major energy market after Singapore. The transaction was completed at an enterprise value of A$6.5B, equivalent to about 6.6x trailing adjusted EBITDA. Management’s transaction analysis indicated that the acquisition would have increased pro-forma FY2024 EPS by approximately 9%, although the actual outcome will depend on refinancing costs, integration and Australian power-market conditions. No equity fundraising was required.
KEY INSIGHTS #2
Singapore gas remains the cash engine, but 2026 margin pressure is already understood.
Gas and related services generated S$701M of underlying net profit in FY2025, representing the majority of group earnings. The segment remains valuable because it provides recurring cash flow to fund renewables development and support dividends. However, management has warned that newly contracted Singapore gas volumes will face lower margins in 2026 as gas prices and generation spreads normalise. FY2025 gas earnings already declined 4%, reflecting weaker UK performance and narrower Singapore spreads.

0883 HK
Oil prices provide the macro kicker, but production growth is the structural driver
KEY INSIGHTS #1
Foundry recovery is translating into higher utilisation, ASP and margins.
Brent crude was recently around US$85.6/bbl, providing a favourable near-term earnings backdrop. CNOOC’s realised crude price was already US$75.92/bbl in 1Q26, up 4.5% YoY, helping oil and gas sales rise despite broader concerns over long-term Chinese petroleum demand. The stronger point is volume. CNOOC produced 205.1M boe in 1Q26, up 8.6% YoY, with domestic production rising 7.0% and overseas output increasing 12.3%. This gives CNOOC an earnings buffer that refiners such as Sinopec lack: it benefits directly from higher upstream volumes without being exposed to weak Chinese refining and petrochemical margins.
KEY INSIGHTS #2
Low-cost production keeps the cash engine resilient across the oil cycle.
CNOOC’s operating cost remained broadly flat at US$6.66/boe in 1Q26, although all-in cost increased to US$28.41/boe from US$27.03 due partly to taxes and exchange-rate movements. The cost base remains highly competitive relative to prevailing oil prices, leaving substantial operating cash-flow headroom even under a material crude-price correction. The company is also targeting 780M–800M boe of production in 2026 and 810M–830M boe in 2027. That creates a visible multi-year production growth path rather than relying solely on higher commodity prices for earnings expansion.

1347 HK
Mature-node recovery, Huali 7nm optionality, but export controls raise execution risk
KEY INSIGHTS #1
Foundry recovery is translating into higher utilisation, ASP and margins.
Hua Hong’s 1Q26 revenue increased 22.2% YoY to US$660.9M, supported by higher wafer shipments and improved average selling prices. Gross margin expanded by 3.8 percentage points to 13.0%, demonstrating operating leverage as production lines remain highly utilised. Management guided 2Q26 revenue to approximately US$690M–700M and gross margin to 14%–16%. The sequential margin improvement is the most important near-term fundamental signal: fixed-cost absorption is improving, while pricing and product mix are becoming less adverse.
KEY INSIGHTS #2
Capital raise funds the roadmap, but creates near-term supply pressure.
Iluvatar is raising about HK$7.07B via a new H-share sale at HK$476 per share, a 15% discount to its prior close, with proceeds for R&D, product iteration and technology upgrades. Strategically, that is positive because AI chips are capital intensive and product cycles are unforgiving. Tactically, it creates overhang because the placement resets the near-term reference price and adds supply after a sharp post-IPO rally.

GS US
Capital-markets recovery play with higher earnings torque
KEY INSIGHTS #1
Recovery in IPOs, M&A and trading supports earnings upside.
Goldman Sachs has high operating leverage to a recovery in capital-markets activity, particularly in equities trading, M&A advisory and underwriting. If IPO issuance, M&A completions and AI-related financing remain active in 2H26, Goldman should continue to benefit from increased client activity and higher fee generation. However, its earnings remain sensitive to macro factors such as inflation trends, interest-rate expectations and overall market liquidity, with indicators such as CPI and PPI influencing the Fed’s policy path and, consequently, capital-markets activity and client risk appetite.
KEY INSIGHTS #2
Broader earnings mix improves durability.
Goldman’s 2Q26 strength was broad-based, with Global Banking & Markets revenue up 47% YoY to US$14.8bn, Asset & Wealth Management revenue up 20% to US$4.6bn, and investment-banking fees rising 55% to US$3.4bn. While equities trading and ROE may moderate from exceptional levels, a growing deal backlog, expanding wealth-management platform and US$5.36bn of quarterly capital returns should support earnings and shareholder returns above prior-cycle levels.

JPM US
Defensive core bank with broad-based earnings resilience
KEY INSIGHTS #1
Higher NII and active capital markets support bank earnings.
JPMorgan remains a core beneficiary of a constructive U.S. banking environment, supported by resilient net interest income, stronger investment-banking activity and elevated trading volumes. While current capital-markets conditions may normalise in 2H26, the bank’s diversified revenue base across consumer banking, markets, investment banking and wealth management provides more defensive earnings support than peers that rely more heavily on trading or deal activity.
KEY INSIGHTS #2
Diversified franchise and credit resilience support shareholder returns.
JPMorgan’s scale, capital strength and asset quality make it suitable as a defensive core holding among U.S. banks. Management raised FY26 net interest income guidance to around US$105.5bn and lowered its Card Services net charge-off outlook to approximately 3.4%-3.6%, reflecting better-than-expected interest income and consumer credit performance. The bank also continued to return capital through dividends and buybacks, distributing roughly US$10bn in 2Q26 alone, supported by strong profitability and a solid CET1 ratio of around 15%.
STOCKS
–
STOCKS
STOCKS
–