Mutual Funds ┃ 30 April 2026
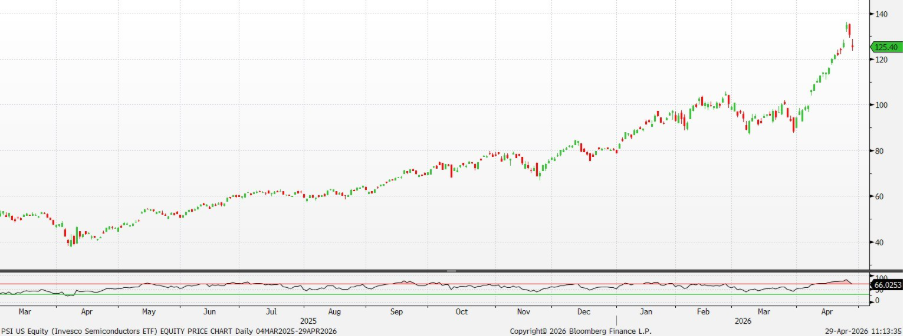
Invesco Semiconductors ETF (PSI US)
- Multi-Factor Stock Selection. The index applies a quantitative, multi-factor approach, evaluating price momentum, earnings momentum, quality, management actions, and valuation. This helps tilt toward fundamentally stronger companies across cycles, supporting capital appreciation.
- Capturing Industry Trends. The ETF rebalances quarterly, removing names with weakening fundamentals or momentum while adding emerging high-growth semiconductor segments—well-suited to the sector’s cyclical and fast-evolving nature.
- Pure-Play Semiconductor Exposure. Holdings span the full semiconductor value chain, including design, manufacturing, equipment, materials, and testing, positioning the ETF to benefit from AI chip demand, node migration, and capex cycles.
| Fund Name (Ticker) | Invesco Semiconductors ETF (PSI US) |
| Description | Tracks the Dynamic Semiconductor Intellidex Index, aiming to replicate its performance. |
| Asset Class | Equity |
| 30-Day Average Volume | 270,720 |
| Net Assets of Fund (as of 27 April) | USD 1.95B |
| 12-Month Yield (as of 24 April) | 0.00% |
| P/E Ratio (as of 31 March) | 40.83 |
| P/B Ratio (as of 31 March) | 5.77 |
| Expense Ratio (Annual) | 0.56% |
Top Holdings
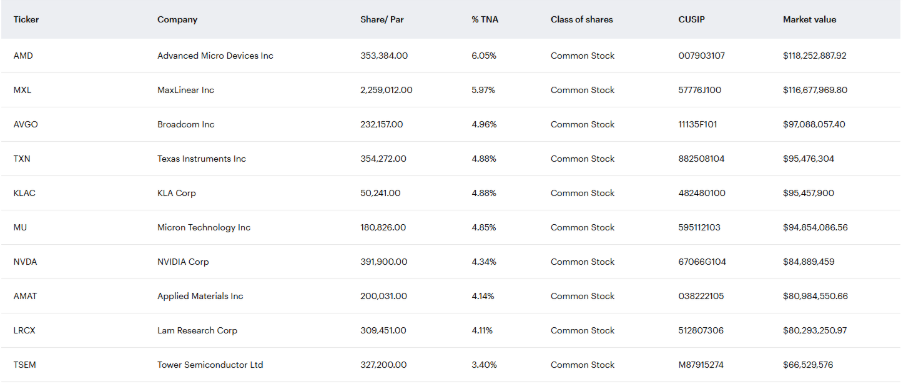
(as of 27 April 2026)

(Source: Bloomberg)

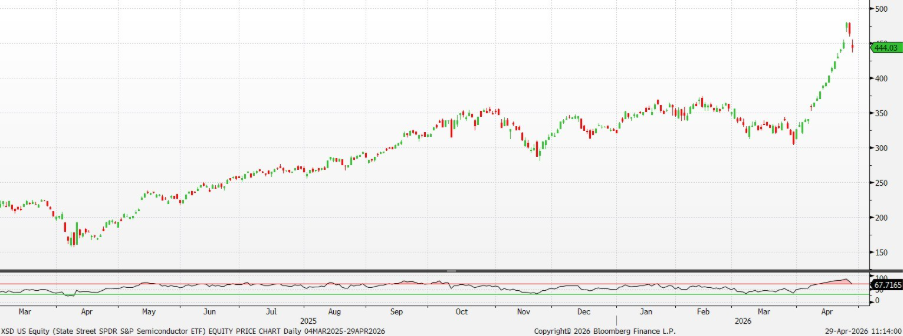
State Street SPDR Semiconductor ETF (XSD US)
- Equal-Weight Structure. The index adopts an equal-weight approach, covering US semiconductor leaders and SMIDs, offering exposure to both large-cap stability and small/mid-cap growth. This provides a structural advantage during broad-based rallies beyond mega caps.
- Diversified Holdings. Holds ~40–46 stocks, with the top 10 accounting for only ~30–35%, reducing single-stock concentration risk.
- Competitive Fees. Expense ratio of ~0.35%, slightly below most semiconductor-themed ETFs, supporting cost efficiency for long-term investors.
| Fund Name (Ticker) | State Street SPDR Semiconductor ETF (XSD US) |
| Description | Tracks the S&P Semiconductor Select Industry Index, aiming to replicate its performance. |
| Asset Class | Equity |
| 30-Day Average Volume | 54,556 |
| Net Assets of Fund (as of 27 April) | USD 2,382.71 M |
| 12-Month Yield (as of 27 April) | 0.1822% |
| P/E Ratio (as of 31 March) | 31.3 |
| P/B Ratio (as of 31 March) | 5.63 |
| Expense Ratio (Annual) | 0.35% |
Top Holdings
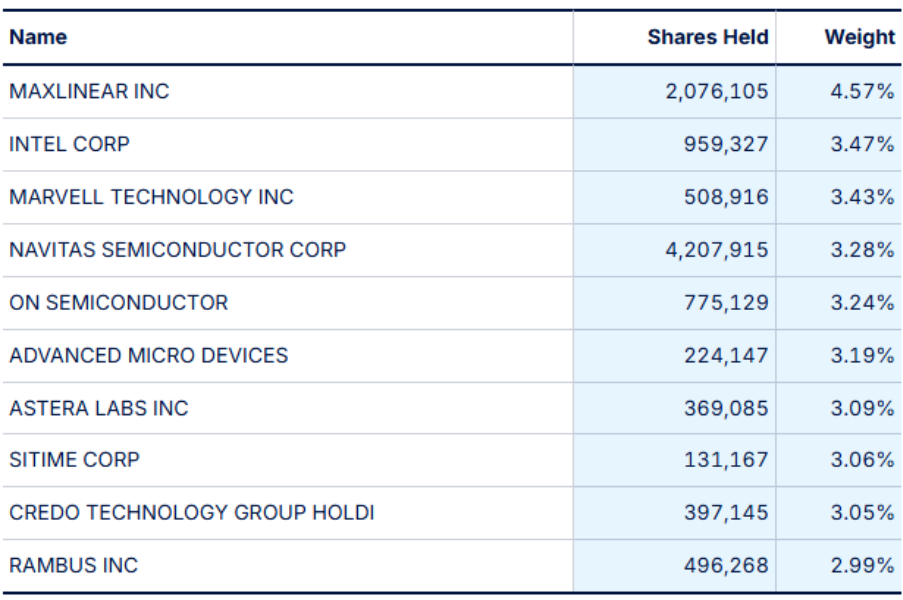
(as of 27 April 2026)

(Source: Bloomberg)

