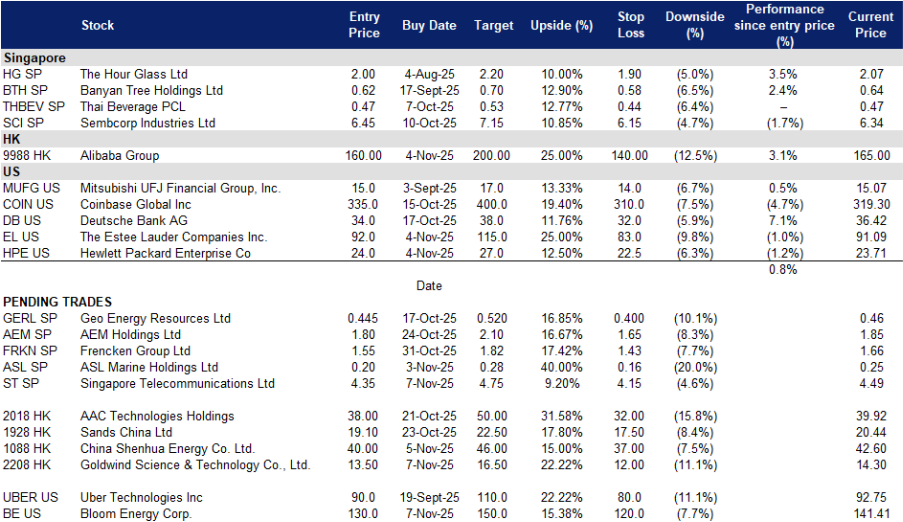
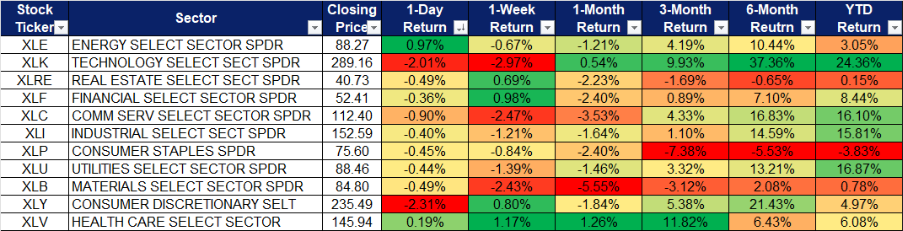
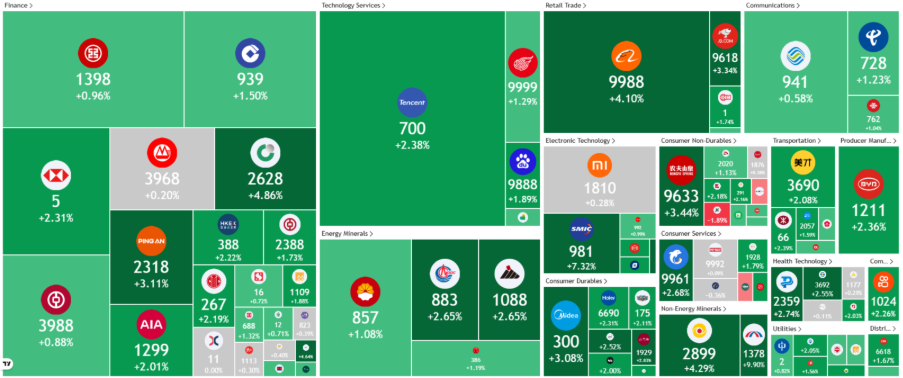
Sector Performance | Hong Kong Trading Ideas |United States Trading Ideas | Singapore Trading Ideas| Trading Dashboard

United States

Hong Kong

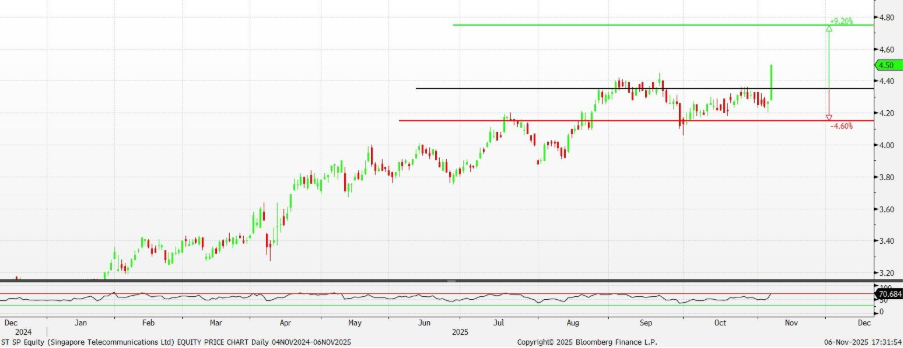
Singapore Telecommunications Ltd (ST SP): Data Centers and Asset Recycling Support Constructive Setup
- BUY Entry – 4.35 Target – 4.75 Stop Loss – 4.15
- Singapore Telecommunications Limited wireless telecommunication services. The Company offers a diverse range of services including fixed, mobile, data, internet, TV, and digital solutions. Singapore Telecommunications serves customers worldwide.
- Latest print shows operating momentum across Optus, NCS and associates. Q1 FY26 underlying net profit S$686m, up 14% year on year. OpCo EBIT up 10% on stronger Optus and NCS. Regional associates’ PAT up 15% with Airtel India and AIS leading. Optus mobile service revenue up 4%, Optus EBITDA up 9% and EBIT up 36%. NCS revenue up 4% and EBIT up 22%, supported by higher delivery margins and S$0.7b bookings in the quarter. These are clean operating improvements ahead of 1H results on 12 Nov 2025.
- Nxera data centers scale into AI demand with >200MW capacity target by 2026. Management guides to more than 200MW regional capacity by Dec 2026 across Singapore, Malaysia, Thailand and Indonesia. In Singapore, Nxera’s next 58MW facility is slated to open in 2026, backed by S$643m in green loans. Digital InfraCo EBIT rose 29% in Q1 on lower depreciation and utilities, and international data revenue grew 6%. Data center expansion adds a higher-quality earnings stream that is less cyclical than core telecom.
- Capital returns and asset recycling remain strong valuation anchors. Singtel raised its midterm asset recycling target to S$9b and executed a S$2b partial Airtel selldown in Q1. The group added a S$2b Value Realisation Share Buyback program and reiterates a core dividend payout of 70% to 90% of underlying net profit, with a Value Realisation Dividend of 3 to 6 cents per year over the medium term. This framework underpins yield and supports re-rating as operating momentum holds.
- 1Q26 results review. Operating revenue S$3,392m (stable, +3% constant currency), EBITDA S$990m up 1% (+5% constant currency), OpCo EBIT S$418m up 10% (+11% constant currency), regional associates’ PAT S$468m up 15% (+19% constant currency), underlying net profit S$686m up 14% (+17% constant currency). Net profit S$2,882m including S$2.2b exceptional gain from Airtel selldown and Intouch merger.
- Market consensus

(Source: Bloomberg)

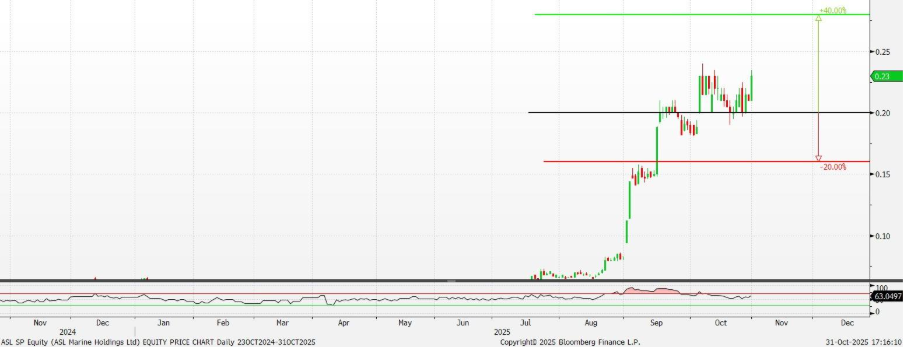
ASL Marine Holdings Ltd (ASL SP): Tuas Tailwind Fuel Further Upside
- RE-ITERATE BUY Entry – 0.20 Target – 0.28 Stop Loss – 0.16
- ASL Marine Holdings Ltd. operates as a holding company. The Company, through its subsidiaries, engages in shipbuilding, shiprepair and conversion, marine vessel chartering, marine engineering, and other related services. ASL Marine Holdings serves customers worldwide.
- Contracted revenue step-up not fully in price. The company disclosed new ship chartering contracts of $82M over about two years, plus vessel sale contracts of $55M to advance deleveraging and streamline the fleet. The charter scope covers tugs, barges, hopper barges, and grab dredgers that support ongoing marine infrastructure works in Singapore. These contracts were announced on 27 Oct 2025, after the June year-end. As of 30 Jun 2025, the long-term shipchartering order book stood at about $38M. Pro forma, the new $82M package would more than double long-term revenue visibility for the chartering segment and underpins earnings through FY26, yet the share price reaction has been muted relative to the quantum of contracted work. This is likely because revenue will be recognised over time, and investors may still be anchored to prior declines in chartering revenue. The incremental visibility and mix shift toward longer tenors should support higher utilisation, steadier margins and better cash conversion.
- Macro tailwinds from Singapore marine works and Tuas expansion. MPA notices point to continued reclamation, dredging and port development activities, including Tuas Terminal Phase 2 and works across Tuas View and the northern coast. These projects require exactly the vessel classes ASL operates, such as hopper barges, tugs and workboats. This backdrop supports sustained demand for ship repair and chartering in local waters and adjacent routes. As activity stays elevated, repair margins should remain healthy. In FY25, group gross margin expanded to 17.3%, with ship repair gross margin at 25.8%.
- Deleveraging path and undemanding valuation. FY25 revenue was $350.1M with profit attributable to shareholders of $14.6M. Total borrowings fell to $178.9M and cash rose to $22.8M, aided by vessel disposals and refinancing. The board proposed a first and final dividend of 0.2 cents per share, signalling balance sheet normalisation. With about 988M shares outstanding, market capitalisation around the current price implies an enterprise value near $380M. On FY25 adjusted EBITDA of $83.7M, the EV to EBITDA multiple is about 4 to 5 times, a discount to regional marine services peers, given improving order visibility. Near-term one-off disruptions are possible, such as the one in Batam, but they do not change the multi-year infrastructure demand or the secured charter backlog.
- FY25 results review. FY25 revenue rose by 0.2% to S$350.1m, compared to S$349.3m in FY24. Net profit increased by 272.3% to S$14.6m in FY25, compared to S$3.9m in FY24. Basic earnings per share rose to S$0.015 in FY25, from roughly S$0.004 in FY24.
- Market consensus

(Source: Bloomberg)


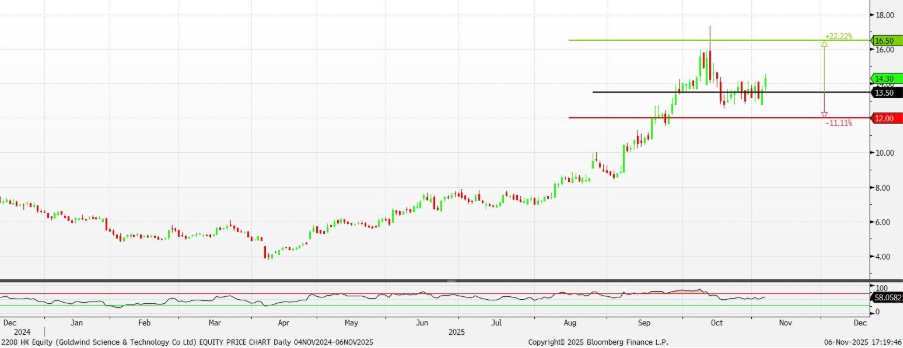
Goldwind Science & Technology Co., Ltd. (2208 HK): Backlog Boom Meets Pricing Reset
- BUY Entry – 13.50 Target – 16.50 Stop Loss – 12.00
- Goldwind Science & Technology Co., Ltd manufactures wind generation equipment. The Company produces wind turbines, wind turbine components, wind power generate ion sets, and other equipment. Goldwind Science & Technology also operates wind farm development, photovoltaic products making, and other businesses.
- China’s tender pipeline and pricing reset support multiyear volumes. Domestic public tenders reached 71.9 GW in 1H25 with an average bidding price of RMB 1,616 per kW in June. Beijing’s 2025 energy plan targets non-fossil capacity at about 60% of the fleet and non-fossil consumption at about 20%, while power pricing reforms push renewables deeper into market-based trading. This combination underpins steady order intake for leading OEMs.
- Mix upgrade and scale are visible in the data. Goldwind sold 10,641 MW externally in 1H25, +106.6% y/y, with 81.5% of sales in ≥6 MW platforms. Backlog stood at 54.8 GW at mid-year, including 51.8 GW external orders, and was 52.5 GW at 3Q. The product shift toward larger turbines and the scale of the backlog support throughput and margin recovery into 2026.
- Services and margin recovery add operating leverage. 1H25 revenue was RMB 28.49B, +41.5% y/y. Overall gross margin was 15.27%. Wind turbine gross margin improved to 7.88% from 3.90% a year ago. Wind power services delivered RMB 2.80B of revenue at 22.48% margin, adding a recurring base as the installed fleet ages. This mix raises earnings quality and cushions cycles.
- 1H25 results review. Revenue RMB 28,493.8M, +41.5% y/y. Profit attributable to ordinary equity holders RMB 1,487.5M, +7.3% y/y. Overall gross margin 15.27%. Wind turbine segment gross margin 7.88%. External sales capacity 10,641 MW, +106.6% y/y. Order backlog 54.8 GW at 30 Jun 2025, with 51.8 GW external and 84% of external backlog in ≥6 MW units.
- Market consensus

(Source: Bloomberg)

China Shenhua Energy Co. Ltd. (1088 HK): Dividend Catalyst in Focus
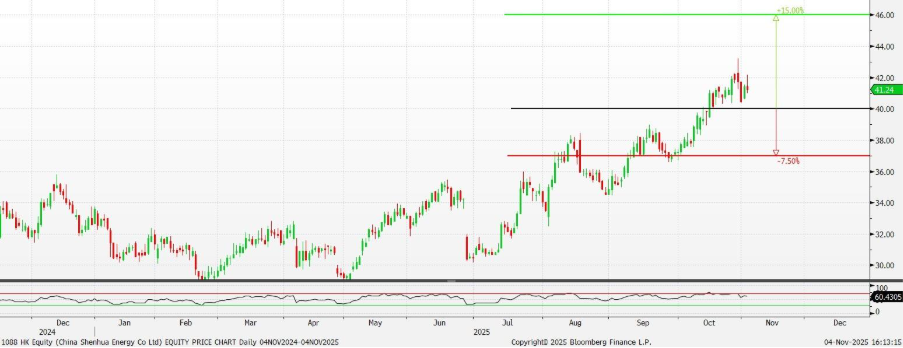
- RE-ITERATE BUY Entry – 40.0 Target – 46.0 Stop Loss – 37.0
- China Shenhua Energy Company Limited mines and distributes coal products. The Company produces brown coal products, bituminous coal products, hard coal products, coking coal products, and other related products. China Shenhua Energy also operates electricity generation, railway transportation, and other businesses.
- Policy keeps coal central to energy security, which anchors Shenhua’s volumes. China finalised a coal production reserve system that targets 300 million tonnes of “dispatchable” annual coal capacity by 2030, roughly 6% of last year’s output, to stabilise supply and prices for power producers. In addition, regulators approved 25 GW of new coal power in 1H 2025, keeping thermal generation available as renewables scale. National rail freight volume rose 3.4% year to date through September 2025, supporting bulk commodity flows. Shenhua’s integrated mine-to-rail-to-port-to-power chain is positioned to monetise this policy-backed throughput.
- Cash generation and dividends continue to support equity value. Operating cash flow in 1H 2025 was RMB 45.8 billion. The board approved an interim dividend of RMB 0.98 per share, payable on 24 December 2025, with Hong Kong payment translated at RMB 1 to HKD 1.096. Consistent and visible cash returns, underpinned by integrated operations, provide a valuation anchor while investors track monthly operating prints.
- Scale and integration show up in hard operating data. In 1H 2025, Shenhua produced 165.4 million tonnes of commercial coal and sold 204.9 million tonnes. Self-owned railway transportation turnover reached 152.8 billion tonne-kilometres, with unit railway cost at RMB 0.080 per tonne-kilometre. The September operating update showed a further improvement, with self-owned railway turnover at 27.0 billion tonne kilometres, up 13.4% year on year. These data points demonstrate cost-advantaged logistics and improved utilisation in the second half.
- 1H25 results review. Revenue decreased by 18.3% to RMB138.109 billion, compared to RMB169.121 billion in 1H24. Profit attributable to equity holders decreased by 14.8% to RMB26.706 billion, compared to RMB31.356 billion in 1H24. Basic earnings per share decreased by 14.8% to RMB1.344 per share in 1H25, compared to RMB1.578 per share in 1H24. Net cash generated from operating activities decreased by 11.7% to RMB45.794 billion from RMB51.890 billion.
- Market consensus

(Source: Bloomberg)


Bloom Energy Corp. (BE US): On-site fuel cells and hydrogen innovation
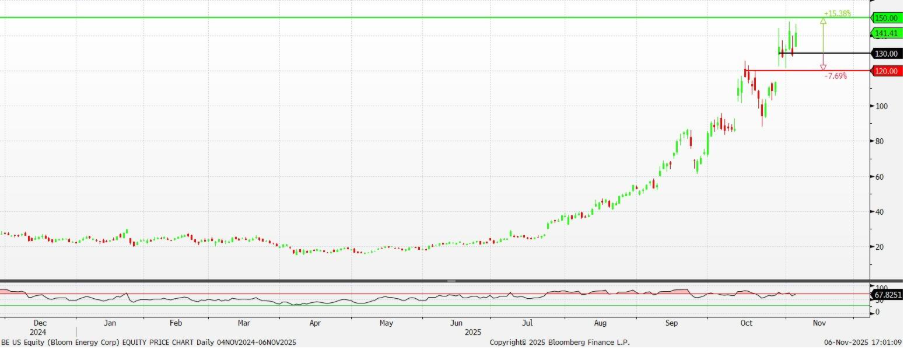
- BUY Entry – 130 Target – 150 Stop Loss – 120
- Bloom Energy Corporation provides a solid-oxide platform for the distributed generation of electricity and hydrogen production. The Company offers solid oxide fuel cells that convert natural gas, biogas, and hydrogen into electricity without combustion, resulting in low CO2 emissions. Bloom Energy serves customers worldwide.
- AI-driven power demand accelerates growth. Bloom Energy is emerging as a key enabler of the AI infrastructure boom through its on-site solid oxide fuel cell systems, which deliver clean, reliable and instantly deployable power. The company’s collaboration with Oracle and partnerships with Equinix and AEP demonstrate strong adoption across data centres requiring an uninterrupted energy supply. Its flexible, combustion-free technology positions Bloom as a scalable solution for powering AI workloads and mission-critical operations.
- Strategic capital infusion strengthens expansion. Brookfield Asset Management’s US$5bn investment in Bloom’s fuel cell technology validates its role in next-generation clean energy infrastructure. The funding supports deployment of AI factories across the U.S. and Europe, including a major site in Europe to be announced by year-end, accelerating global expansion and reinforcing Bloom’s leadership in hybrid, decentralized power systems for the AI era.
- Financial flexibility for growth and R&D. Bloom’s US$2.2bn convertible notes offering, due 2030, enhances its balance sheet and funds manufacturing, R&D and hydrogen initiatives. The company’s expanding electrolyzer business strengthens its position in the hydrogen economy, diversifying revenue streams beyond power generation and aligning with clean energy transition policies.
- 3Q25 results. Revenue rose 57.1% YoY to US$519mn, surpassing estimates by US$92.6mn. Non-GAAP EPS was US$0.15, above estimates of US$0.10. Management now expects full-year results to be better than the previously guided outlook for FY25 revenue of US$1.65bn-US$1.85bn, non-GAAP gross margin of about 29% and non-GAAP operating income to be between US$135mn-US$165mn.
- Market consensus

(Source: Bloomberg)
Hewlett Packard Enterprise Co. (HPE US): Reinventing the enterprise cloud
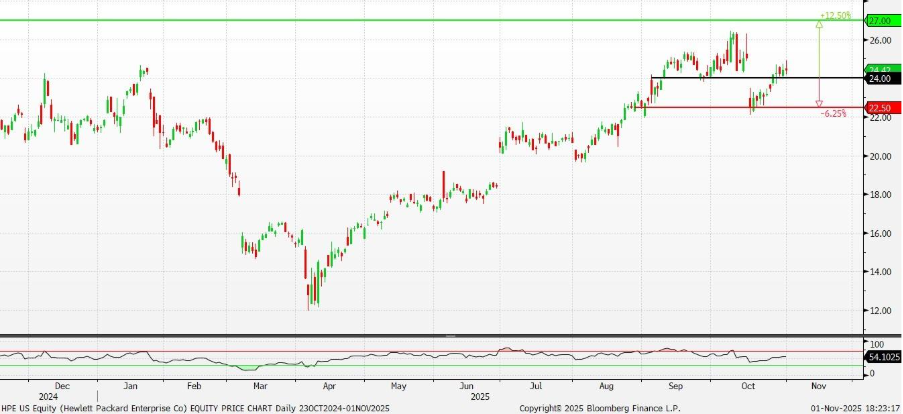
- RE-ITERATE BUY Entry – 24.0 Target – 27.0 Stop Loss – 22.5
- Hewlett Packard Enterprise Company provides information technology solutions. The company offers enterprise security, analytics and data management, applications development and testing, data center maintenance, cloud consulting, and business process services. Hewlett Packard Enterprise serves customers worldwide.
- AI infrastructure and networking transformation. Hewlett Packard Enterprise’s pivot toward AI infrastructure and hybrid cloud positions it at the center of enterprise digital modernization. The successful acquisition of Juniper Networks has doubled HPE’s networking business and integrated AI-native technology across hardware, software, and security, narrowing the competitive gap with Cisco. The new Cloud and AI division will enable HPE to capture the surging demand from enterprises deploying AI-driven workloads, supported by projected global AI infrastructure spending expected to reach US$758bn by 2029.
- Enhancing GreenLake market positioning. GreenLake has shifted from a simple pay-as-you-go cloud infrastructure to a higher-level hybrid cloud/edge/AI platform. As of 3Q25, the company’s ARR is approximately US$3bn, an increase of 77% YoY. GreenLake added 2,000 new customers, bringing its total customer count to 44,000.
- PC refresh and AI-driven edge growth. The ongoing Windows 11 refresh cycle and the rapid rise of AI-capable PCs are catalyzing new infrastructure demand that benefits Hewlett Packard Enterprise’s edge computing and data services. According to IDC, global PC shipments grew 9.4% YoY in 3Q25, with the refresh cycle expected to extend into 2026. As enterprises modernize endpoints to support AI workloads, HPE is well-positioned to capture adjacent growth in compute, storage, and network orchestration.
- 3Q25 results. Revenue increased by 3.1% YoY to US$13.9bn, with non-GAAP diluted earnings per share at US$0.75, down 10.7% YoY. During the quarter, the company returned US$400mn to shareholders in the form of dividends and share repurchases. For Q4, the company expects non-GAAP diluted earnings per share to be between US$0.87 and US$0.97. For FY25, the company anticipates free cash flow to be between US$2.6bn and US$3.0bn. Revenue for FY26 is projected to grow between 17% and 22%, compared to a forecasted growth of 17.2%. Free cash flow is expected to be between US$1.5bn and US$2.0bn, compared to a forecast of US$1.88bn.
- Market consensus

(Source: Bloomberg)


Trading Dashboard Update: Add The Estee Lauder Companies Inc. (EL US) at US$92 and Hewlett Packard Enterprise Co. (HPE US) at US$24. Cut loss on Dell Technologies (DELL US) at US$153.