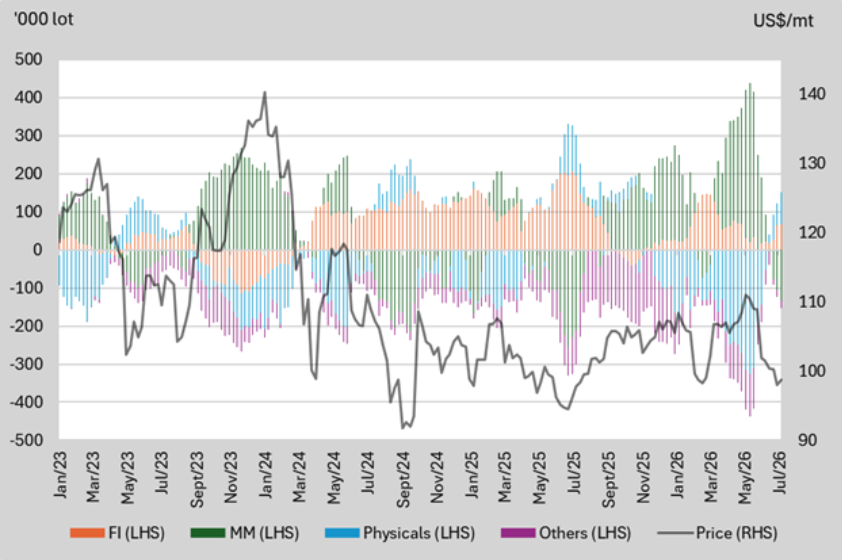
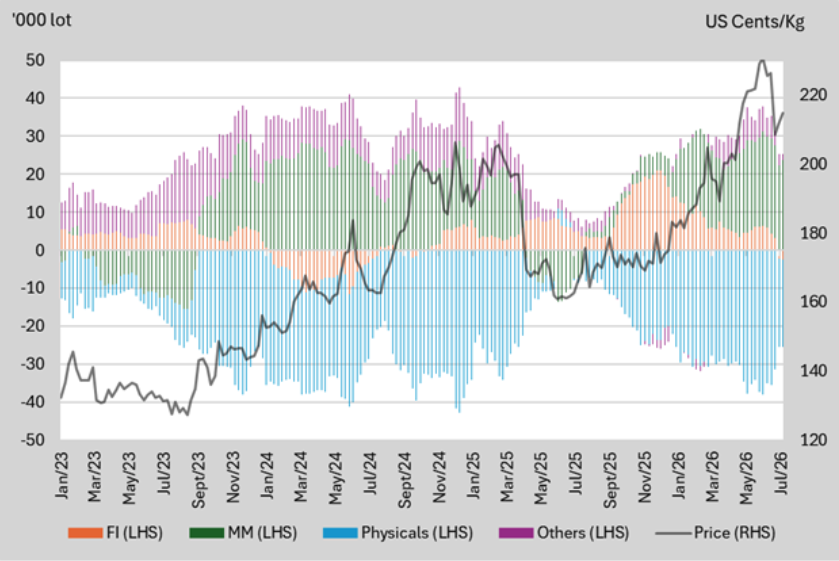
We highlight the key price levels that each participant switches their positions between net long and net short based on 2025 data.
| PARTICIPANT | NET LONG | NET SHORT |
|---|---|---|
| Financial Institution (FI) | Below US$108/mt | N/A |
| Managed Money (MM) | Above US$101/mt | Below US$101/mt |
| Physicals | Below US$100/mt | Above US$101/mt |
| Others | N/A | Below US$108/mt |
Figure 1: Net-positions by participant segment and price comparison | Source: SGX, KGI Research
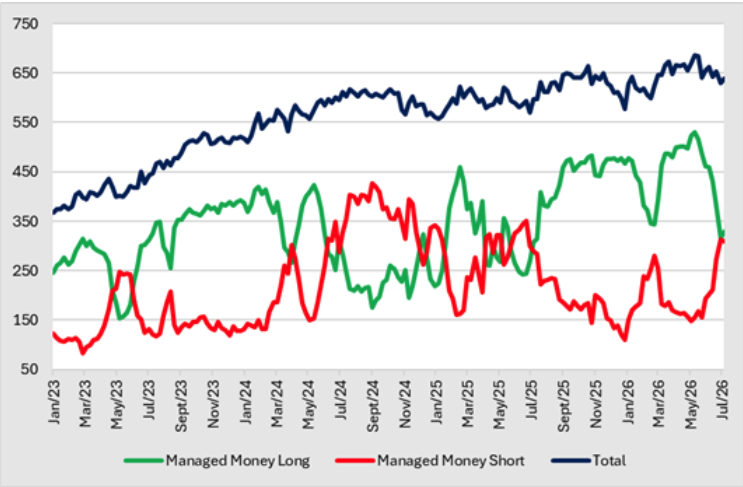
The number of MM with long positions rose to 329 after falling for seven consecutive weeks. Accordingly, the number MM with short positions fell to 310 after rising for five consecutive weeks. Seasonally, more MMs are prone to long in 1HQ4 and 2HQ2, and there are more MMs with short positions in 1HQ2 and 1HQ3.
| 2025 | 2024 | |||
|---|---|---|---|---|
| Long | Short | Long | Short | |
| High | 483 | 350 | 423 | 427 |
| Low | 219 | 121 | 176 | 131 |
Figure 2: Number of position holders iron ore | Source: SGX, KGI Research
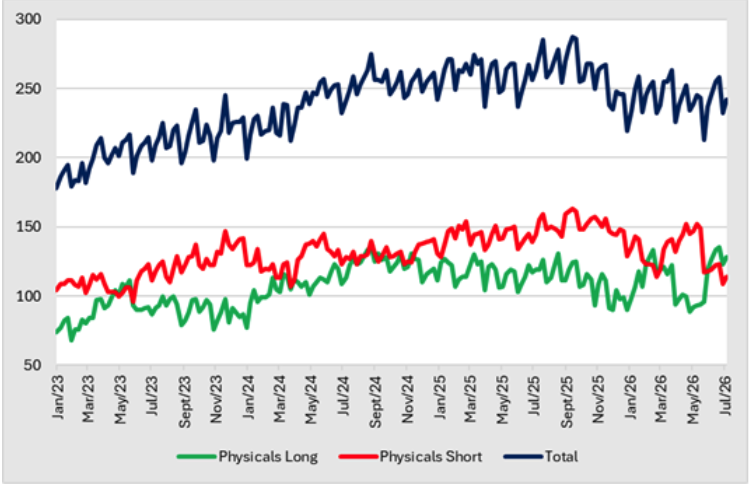
The number of physicals with long positions increase to 128 after previous week’s decline. Accordingly, the number of physicals with short positions increase to 114 after previous week’s decline. Seasonally, more physicals are prone to being long in 1Q, and there are more physicals with short positions in Q4.
| 2025 | 2024 | |||
|---|---|---|---|---|
| Long | Short | Long | Short | |
| High | 131 | 163 | 135 | 145 |
| Low | 90 | 128 | 77 | 107 |
Figure 3: Number of position holders iron ore | Source: SGX, KGI Research
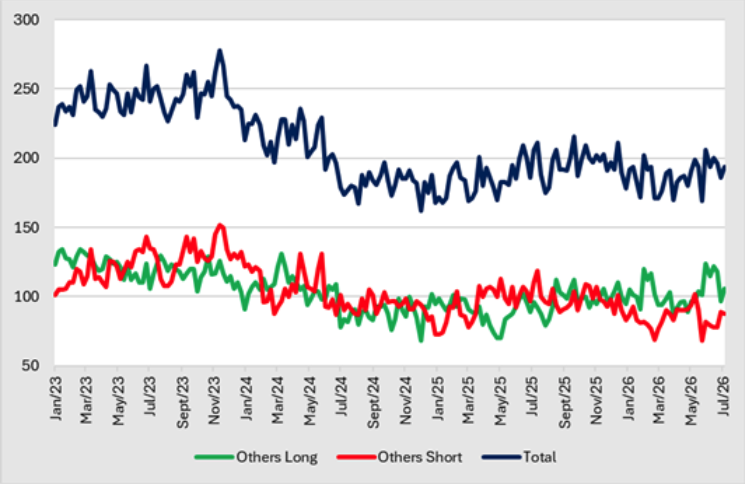
The number of others with long positions increase to 106 after decreasing for two consecutive weeks. The number of others with short positions decrease slightly to 88 after previous week’s increase.
| 2025 | 2024 | |||
|---|---|---|---|---|
| Long | Short | Long | Short | |
| High | 112 | 119 | 131 | 131 |
| Low | 70 | 73 | 68 | 83 |
Figure 4: Number of position holders iron ore | Source: SGX, KGI Research
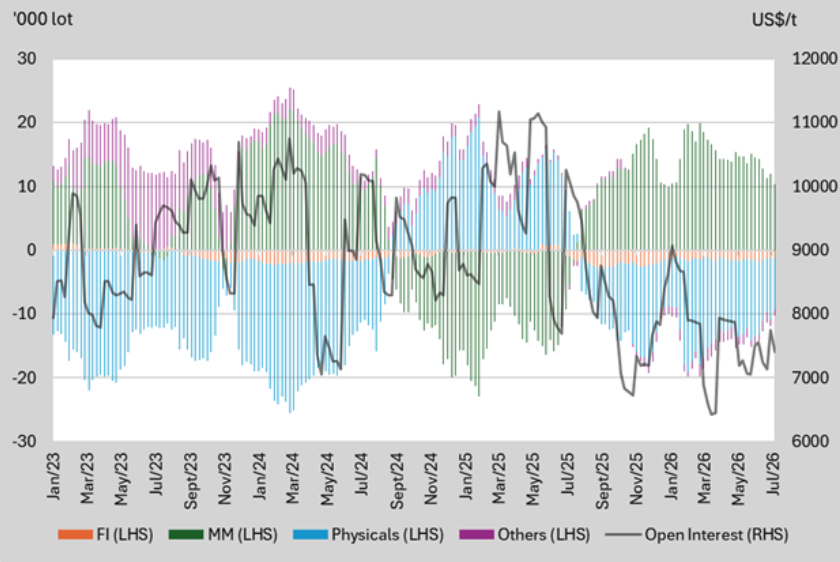
We highlight the key price levels at which each participant switches between net long and net short, based on 2025 data.
| PARTICIPANT | NET LONG | NET SHORT |
|---|---|---|
| Financial Institution (FI) | N/A | N/A |
| Managed Money (MM) | Above US$7,000/t | Below US$11,000/mt |
| Physicals | Below US$11,000/mt | Above US$7,000/t |
| Others | Below US$11,000/mt | Above US$7,000/t |
Figure 5: Net-positions by participant segment and price comparison | Source: SGX, KGI Research
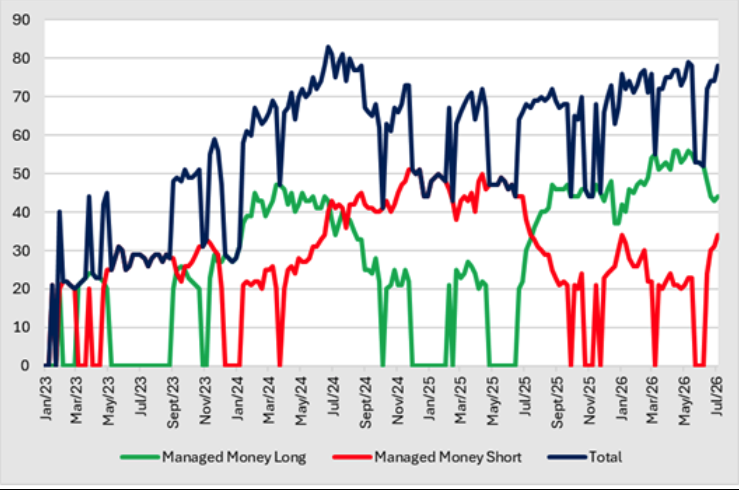
The number of MM with long positions increase to 44 after decreasing for four consecutive weeks. Accordingly, the number of MM with short positions increase for four consecutive weeks to 34. Seasonally, more MM are prone to long in 1H, and there are more MM with short positions in 2H.
| 2025 | 2024 | |||
|---|---|---|---|---|
| Long | Short | Long | Short | |
| High | 48 | 50 | 47 | 51 |
| Low | 20 | 20 | 20 | 20 |
Figure 6: Number of position holders freight futures | Source: SGX, KGI Research
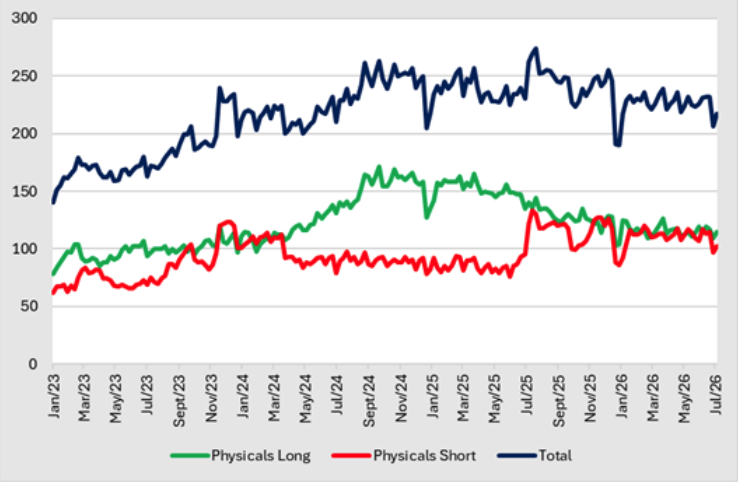
The number of physicals with long positions increase to 115 after decreasing for two consecutive weeks. Accordingly, the number of physicals with short positions rose to 102 after previous week’s decline. The number of physicals has been on a general upward trend since 2Q24, while physicals with short positions generally saw a downtrend since 2Q24.
| 2025 | 2024 | |||
|---|---|---|---|---|
| Long | Short | Long | Short | |
| High | 165 | 133 | 171 | 114 |
| Low | 103 | 76 | 98 | 78 |
Figure 7: Number of position holders freight futures | Source: SGX, KGI Research
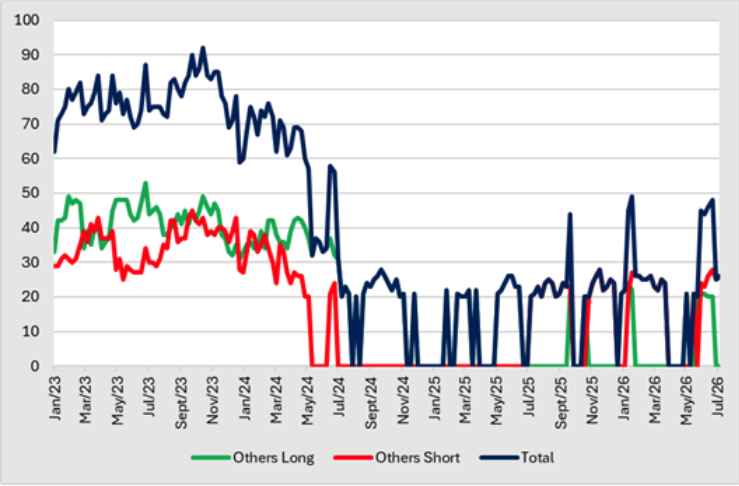
The number of others with long positions remain unchanged at 20 for three consecutive weeks and the number of others with short positions rose to 26 after previous weeks’ decline.
| 2024 | 2023 | |||
|---|---|---|---|---|
| Long | Short | Long | Short | |
| High | 26 | 28 | 43 | 39 |
| Low | 20 | 20 | 20 | 20 |
Figure 8: Number of position holders freight futures | Source: SGX, KGI Research
We highlight the key price levels at which each participant switches between net long and net short, based on 2025 data.
| PARTICPANT | NET LONG | NET SHORT |
|---|---|---|
| Financial Institution (FI) | Below US$2.05/kg | N/A |
| Managed Money (MM) | Above US$1.70/kg | Below US$1.70/kg |
| Physicals | Below US$1.65/kg | Above US$1.65/kg |
| Others | Below US$2.05/kg | N/A |
Figure 9: Net-positions by participant segment and price comparison | Source: SGX, KGI Research
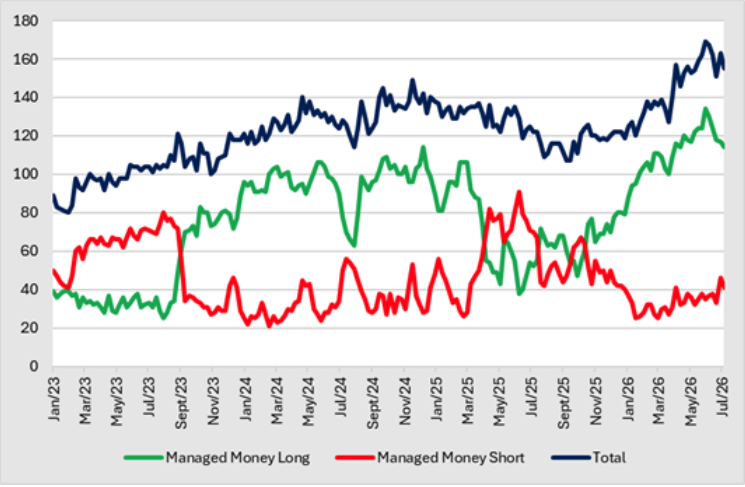
The number of MM with long positions decrease for five consecutive weeks to 114. Accordingly, the number of MM with short positions decrease to 41 after previous week’s rise.
| 2025 | 2024 | |||
|---|---|---|---|---|
| Long | Short | Long | Short | |
| High | 106 | 91 | 114 | 56 |
| Low | 38 | 26 | 63 | 21 |
Figure 10: Number of position holders rubber futures | Source: SGX, KGI Research
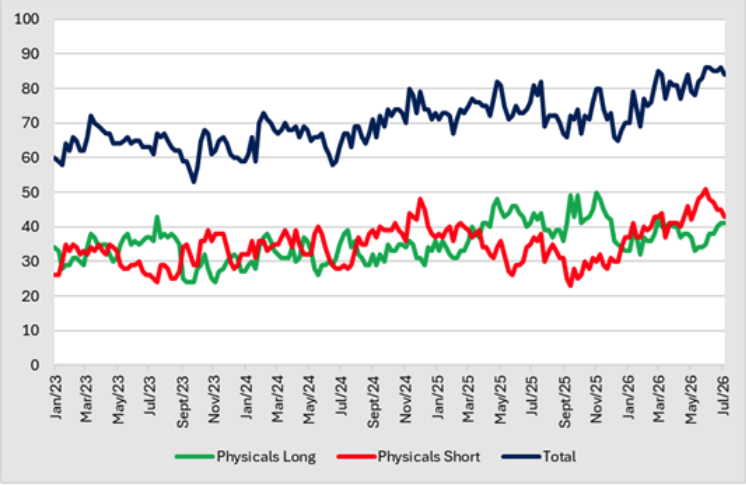
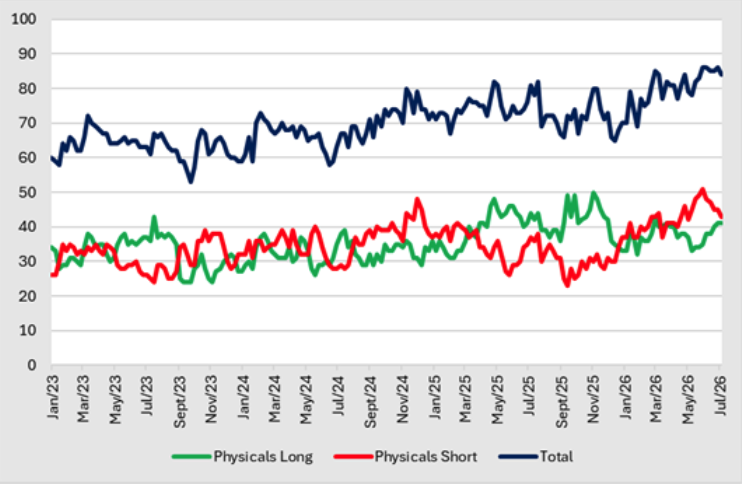
The number of physicals with long positions remain unchanged at 41. Accordingly, the number of physicals with short positions decrease to 43 after previous week’s consolidation. Seasonally, more physicals are prone to long in early Q3, and there are more physicals with short positions in Q4.
| 2025 | 2024 | |||
|---|---|---|---|---|
| Long | Short | Long | Short | |
| High | 50 | 41 | 39 | 48 |
| Low | 31 | 23 | 26 | 28 |
Figure 11: Number of position holders rubber futures | Source: SGX, KGI Research
The number of long holders decrease for three consecutive weeks to 49. Accordingly, the number of short holders decrease for four consecutive weeks to 32.
| 2025 | 2024 | |||
|---|---|---|---|---|
| Long | Short | Long | Short | |
| High | 62 | 42 | 77 | 48 |
| Low | 41 | 27 | 48 | 26 |
Figure 12: Number of position holders rubber futures | Source: SGX, KGI Research
Source: SGX, KGI Research
| CATEGORY | DESCRIPTION |
|---|---|
| Financial Institutions | An entity, such as a broker trading desk, bank trading desk or swap dealer, that uses the futures markets to manage or hedge the risk. |
| Managed Money | An entity engaged in organised futures trading on behalf of funds or special investment vehicles — including pension funds, asset managers, hedge funds, proprietary trading groups and family offices. |
| Physicals | An entity that predominantly engages in the physical markets and uses futures to manage or hedge risks associated with production, processing, trading, packing, handling, transportation, warehousing or distribution of a physical commodity. |
| Others | Every other trader not placed into the other three categories. E.g., Broker Agency, Bank Agency, Inter-Dealer Brokers, etc. |